Energy Transition Index 2026


Appendices
A1.1 ETI methodology
This section provides details about the methodology of the 2026 edition of the ETI. It comprises the following parts:
- Index design, composition and calculation
- Coverage and indicator selection criteria
- Comparability and updates in the 2026 energy transition
Index design, composition and calculation
The ETI framework is structured to ensure:
– Balanced perspective on current performance and future readiness
– Diversity in energy transition pathways, accounting for context-specific challenges
– Alignment with international frameworks and energy goals
– Comparability across time with data going back to 2017118
– Contextualized, data-driven analysis for meaningful insights
– Forward-looking orientation, enabling actionable outcomes
The ETI score is calculated as a weighted average of two sub-indices. Each sub-index is the arithmetic average of its component dimensions, which in turn are the arithmetic averages of their respective sub-dimensions, based on the index’s 44 underlying indicators (Figure 24). ETI 2026 results reflect the latest available data at the time of collection.
Figure 24: Methodology and indicators

The ETI score uses a 0–100 scale, where 100 represents the best possible value and 0 the worst. To allow comparability and aggregation, each indicator is normalized to the 0–100 scale using a minimum-maximum formula.

The sample minimum and sample maximum are the lowest and highest value for countries covered by the ETI. For those indicators for which a higher value indicates a worse outcome (e.g. wholesale gas prices), the study relies on a normalization formula that, in addition to converting the series to a 0–100 scale, reverses it, so that 0 and 100 still correspond to the worst and best, respectively.
In many cases, however, adjustments are made to the sample minimum and maximum to account for issues such as outliers, with winsorization being the most common technique.
Coverage and indicator selection criteria
The ETI 2026 assesses 120 countries. To be covered in the index, a country needs to have data for most of the index’s 44 indicators, including sufficient coverage for each dimension.
The following principles guide the selection of indicators:
1. Relevance: alignment of parameters with core aspects of the energy transition
2. Recency and comparability: use of the most recent and cross-country comparable data
3. Source quality and objectivity: reliance on credible, widely recognized and independent data sources
Comparability and updates in the ETI 2026: The ETI is a dynamic benchmark, with structural and indicator-level refinements introduced annually to reflect evolving transition priorities and improvements in data availability. Rankings are based on country performance as measured by the most up-to-date data; however, underlying data sources may periodically revise their datasets, including historical values. These revisions can lead to changes in previously reported results and, consequently, may impact country scores and rankings.
For example, selected IEA data series used in the ETI (see Table 12 for indicators based on IEA data) are subject to routine updates, including retrospective revisions. This is part of the IEA’s standard process of replacing preliminary estimates with more comprehensive demand-side data as they become available. As a result, changes in ETI results over time may reflect both methodological enhancements and updates to underlying data, rather than shifts in country performance alone.
The following updates have been made to the 2026 ETI:
1. Indicator exclusions and replacement
The SAIDI and SAIFI have been excluded from the ETI 2026 score, yet they have been used as part of the methodology for calculating ETI for the period 2017–2025. This change reflects the discontinuation of these datasets by the original source. To maintain coverage of system reliability, the reliability of electricity supply indicator has been introduced as a replacement for assessments from 2026 onward.
2. New indicator additions
The reliability of electricity supply indicator has been incorporated under the reliability sub-dimension to ensure continuity in measuring system reliability. For historical years, SAIDI and SAIFI continue to serve as the relevant proxies, given data availability constraints.
In addition, two new indicators, AI readiness and clean tech minerals import exposure, have been introduced under the infrastructure sub-index. These additions strengthen the framework’s coverage of strategic supply chains and technology-enabling infrastructure critical to the energy transition.
Further details on the new (and all) indicators’ definitions and data sources can be found within Table 12.
A1.2 Indicator definitions and sources
Table 12: Energy Transition Index (ETI) model framework

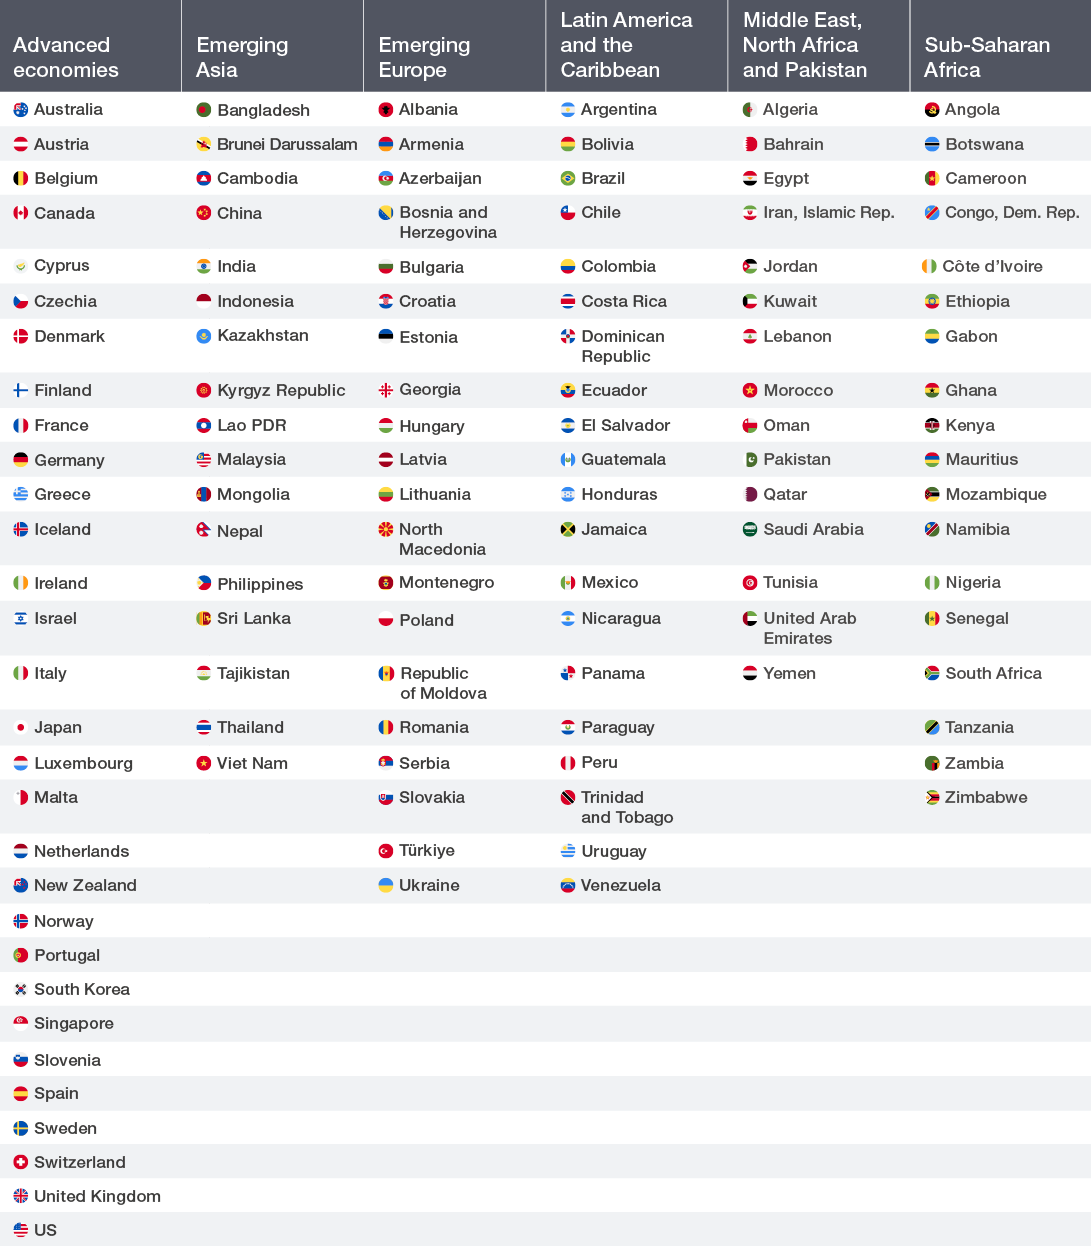
A1.3 Country group classifications
The following country group classifications were used for the index and report:
Table 13: Country group classifications

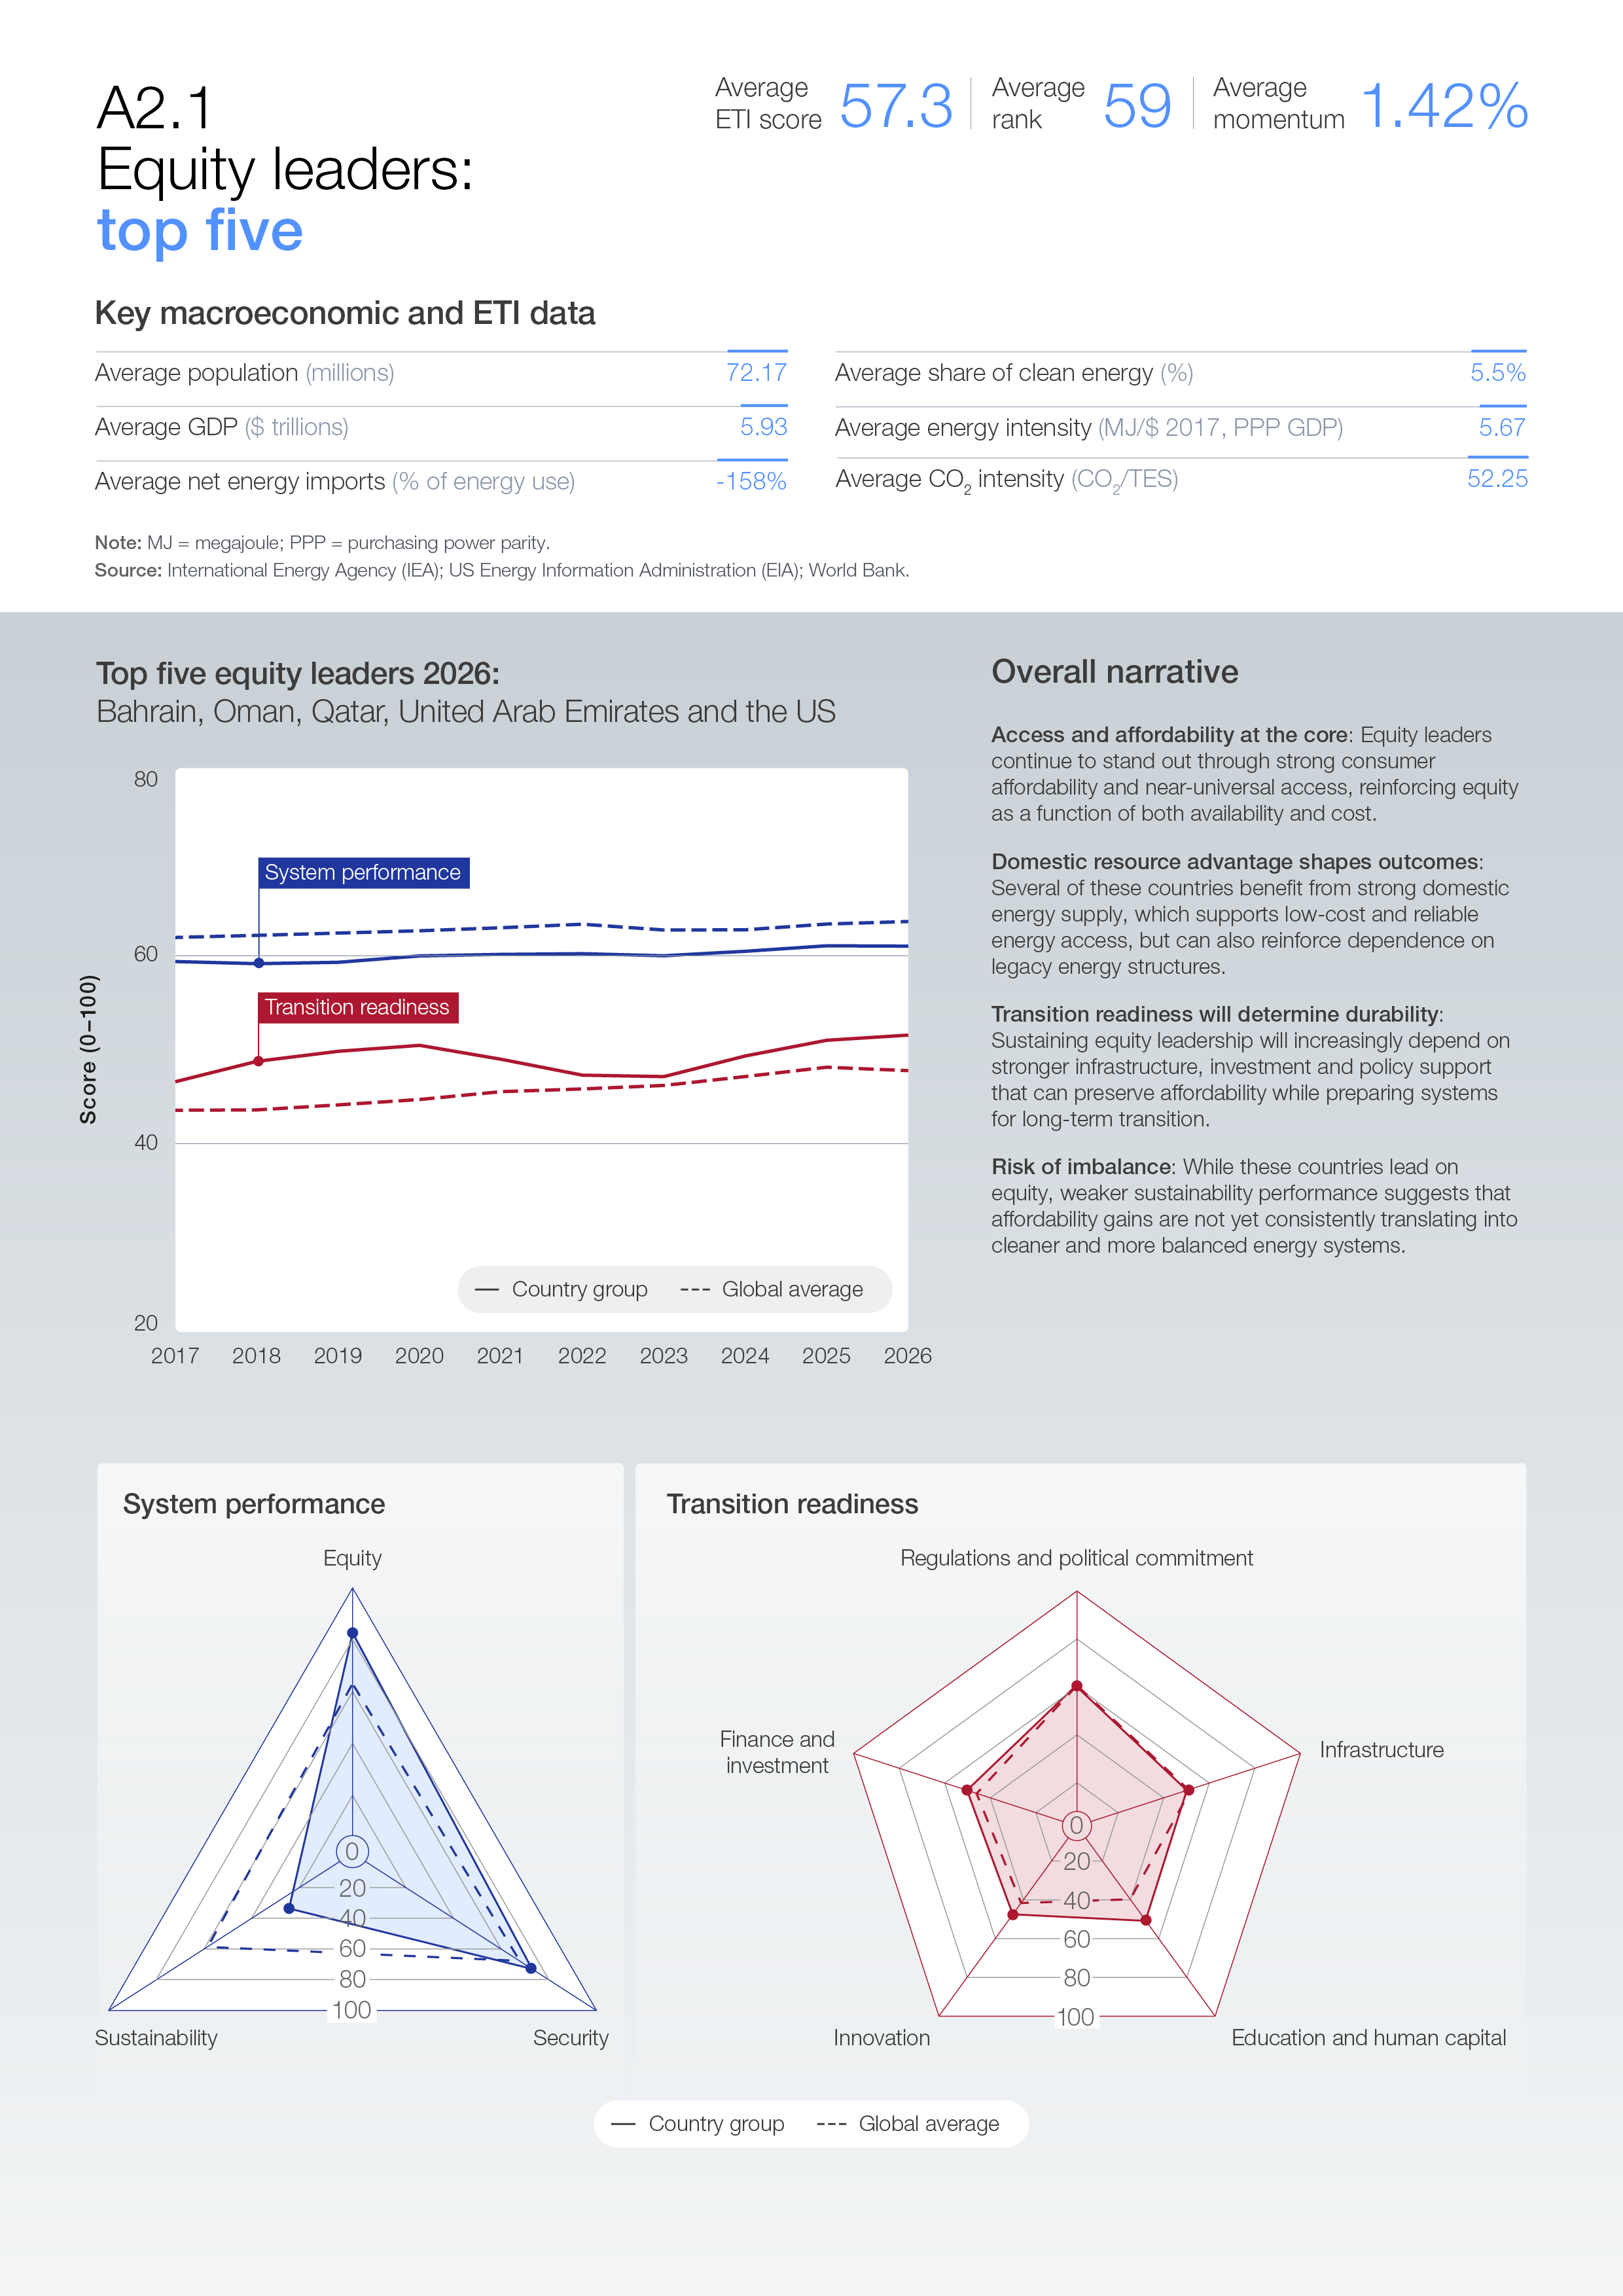
A2.1 Equity leaders: top five

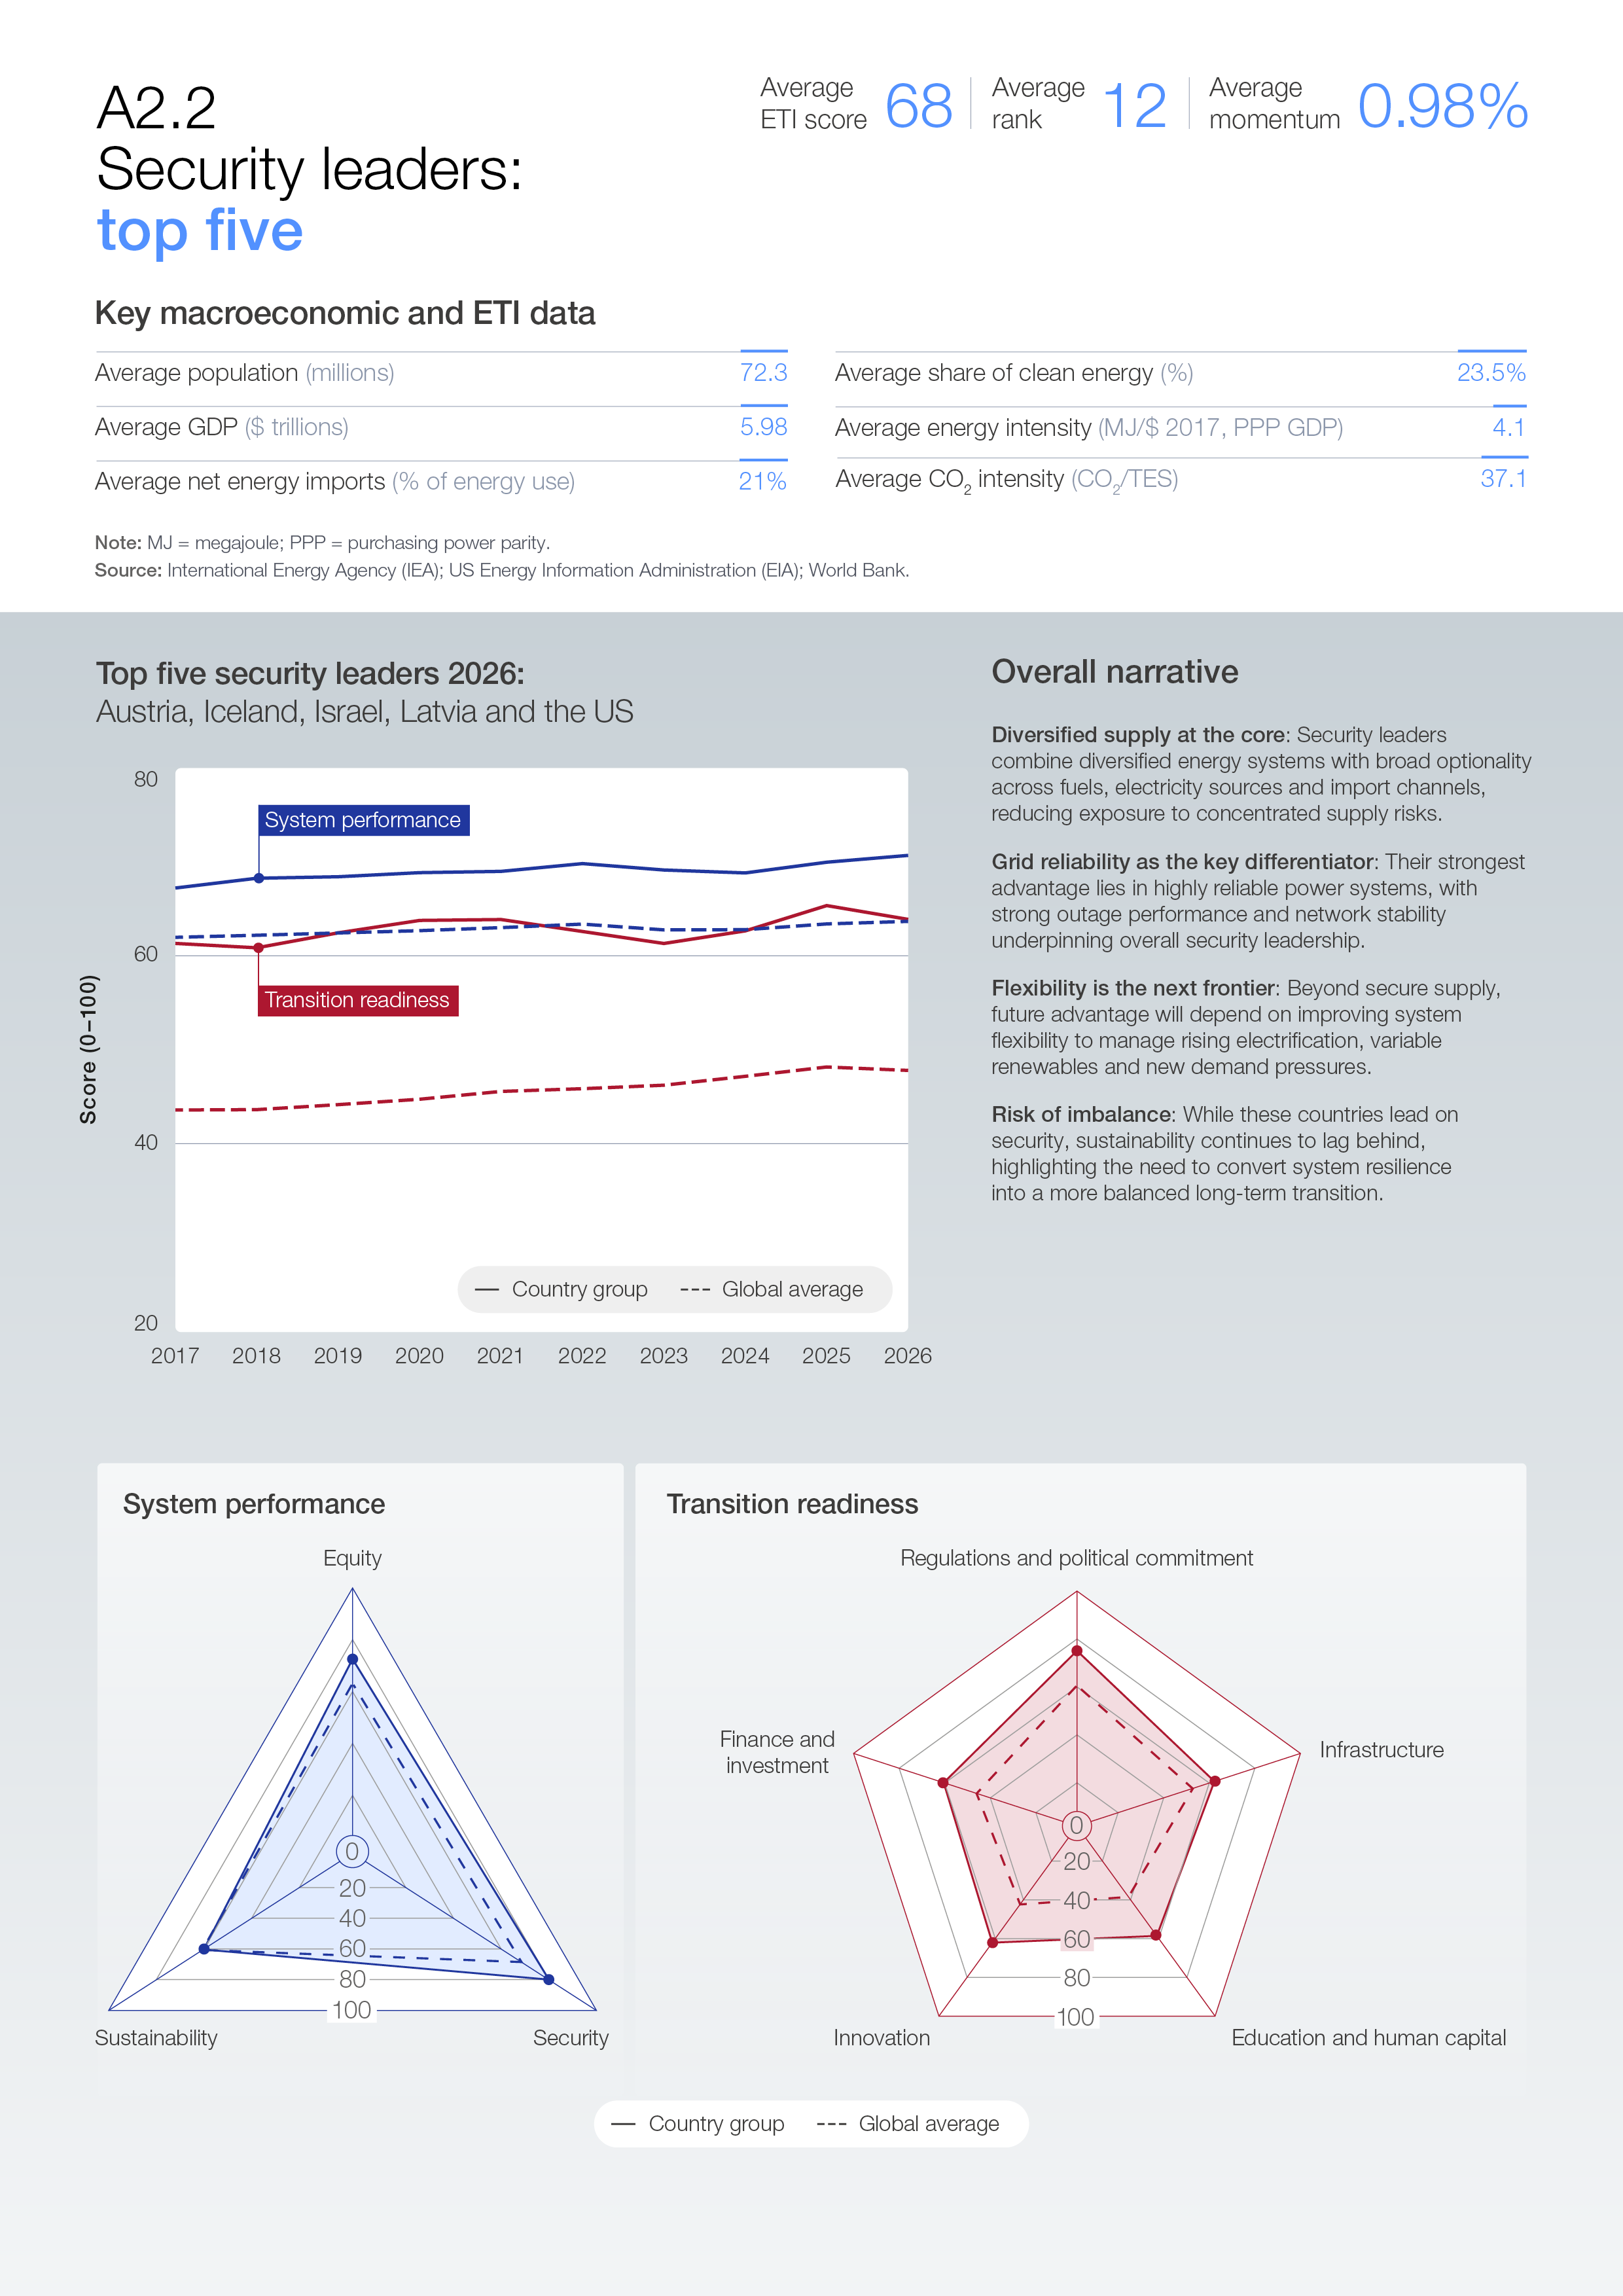
A2.2 Security leaders: top five

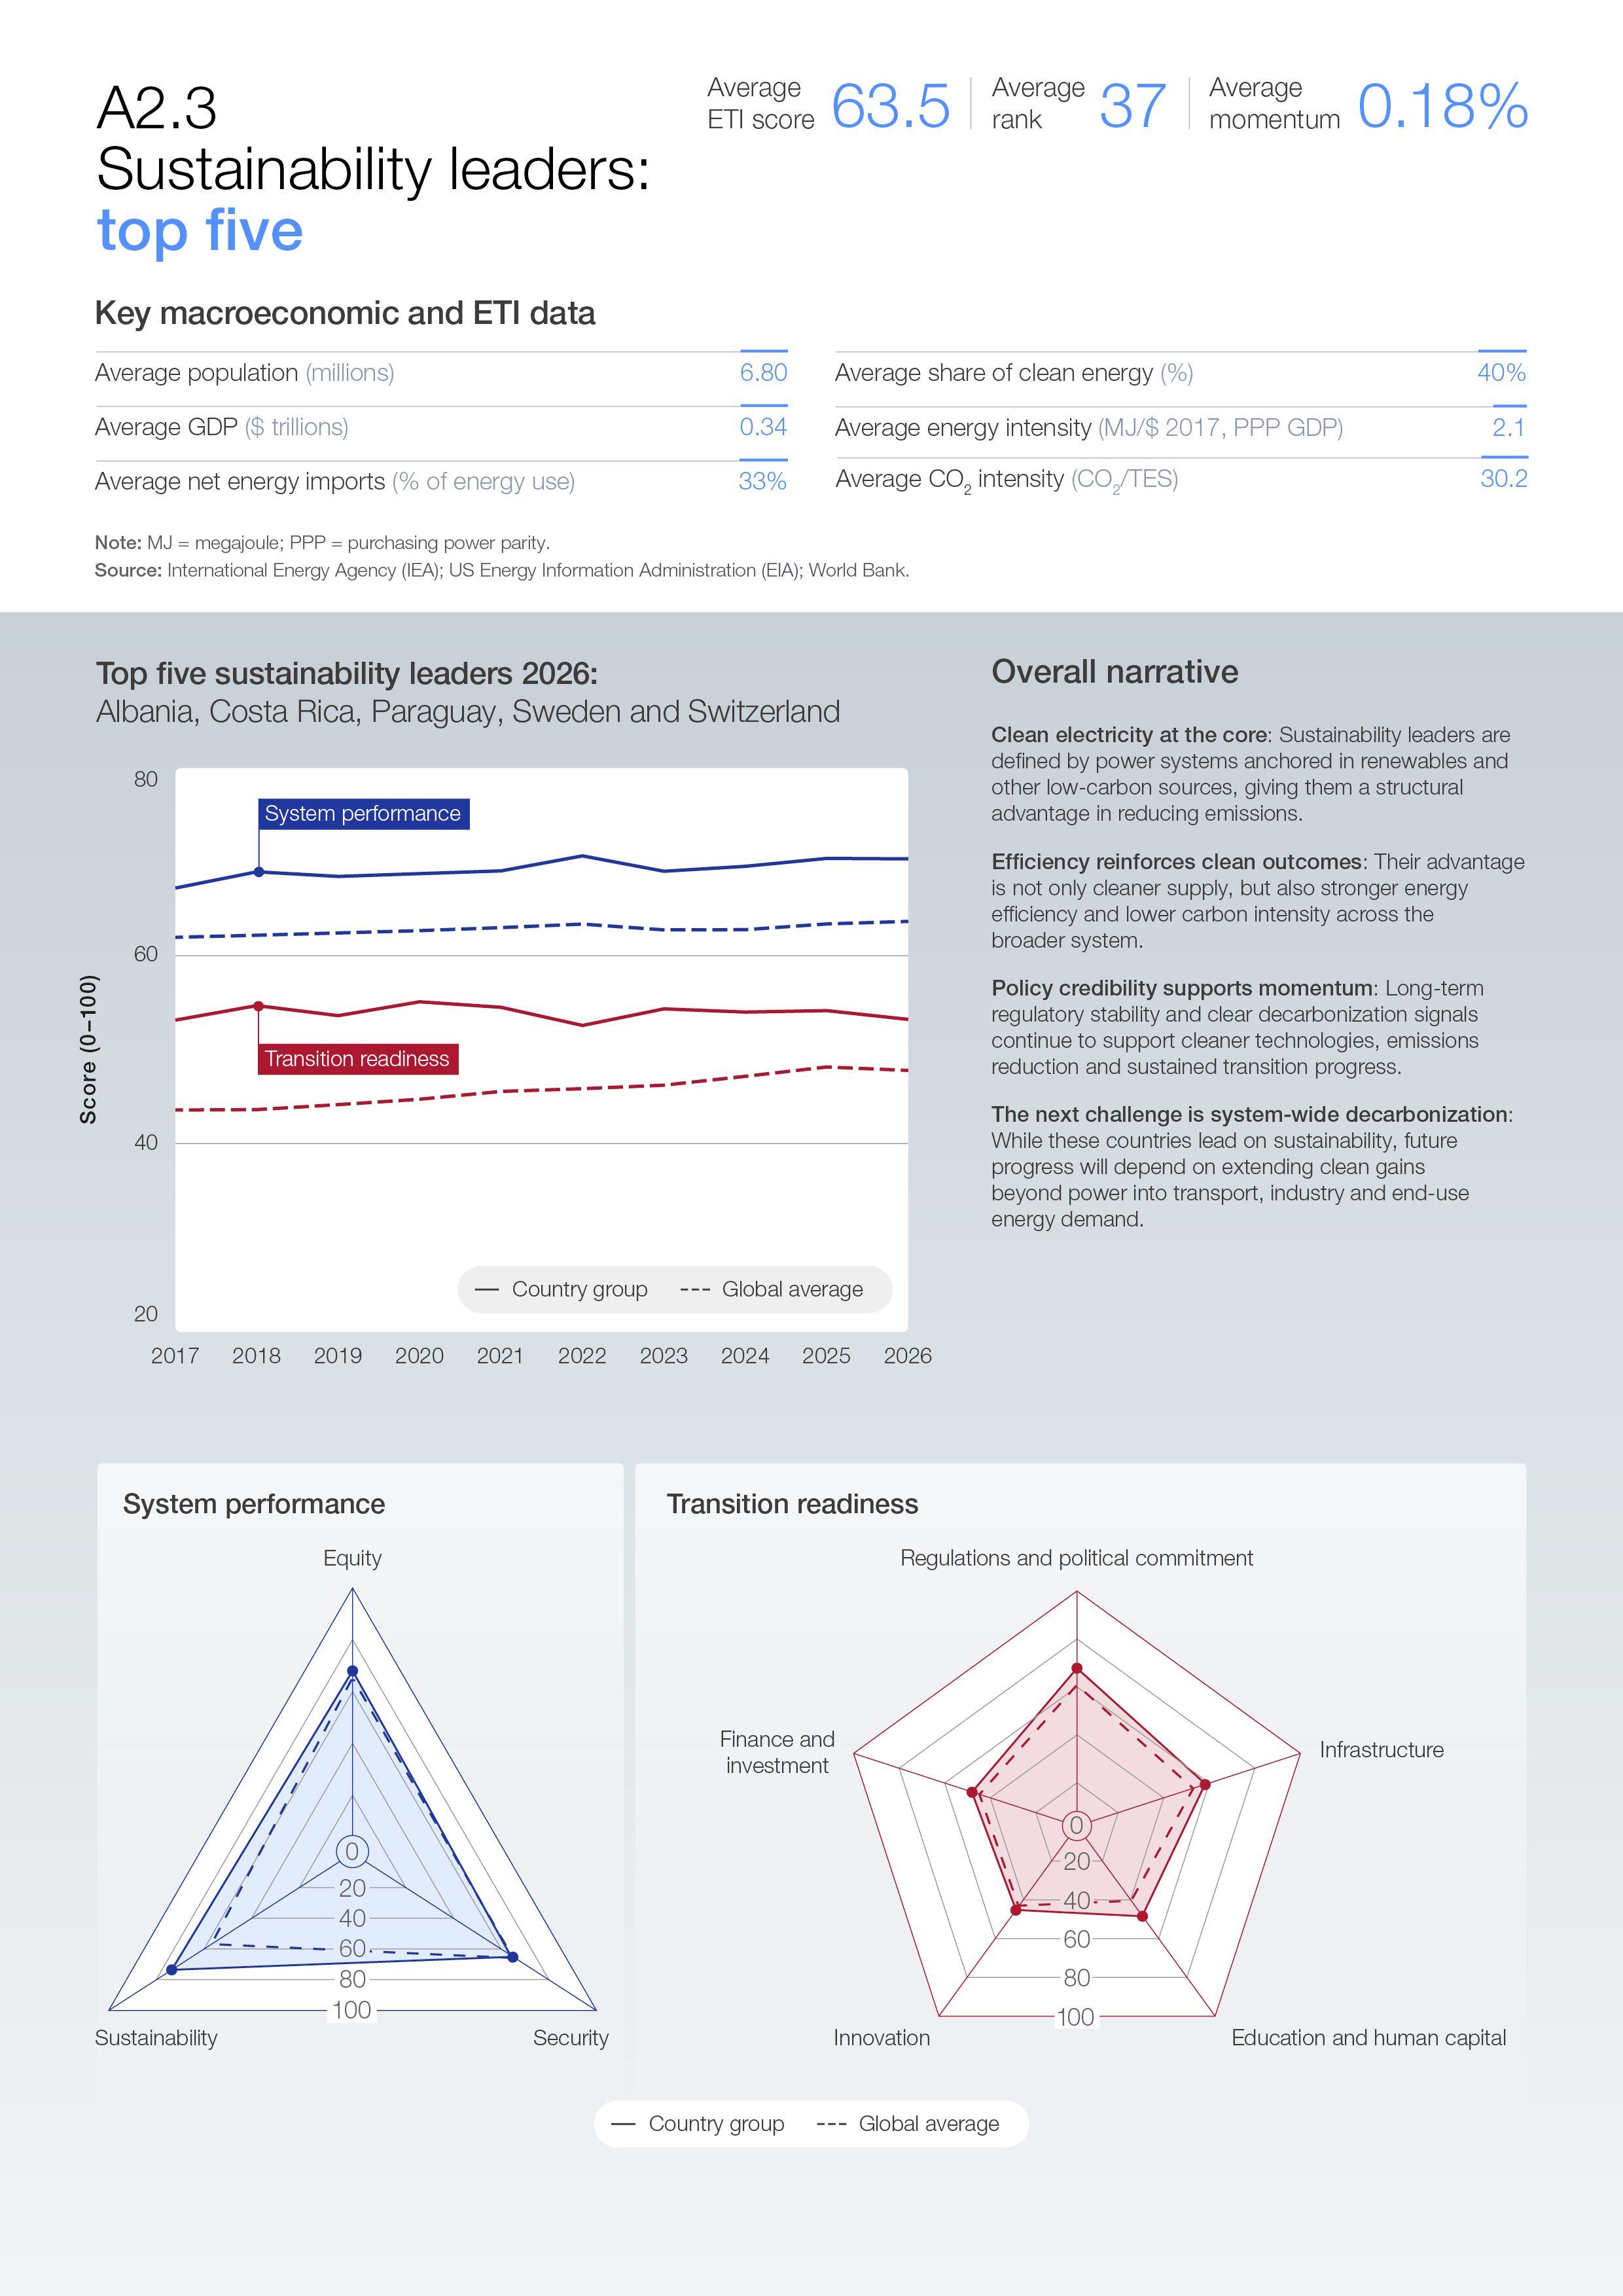
A2.3 Sustainability leaders: top five

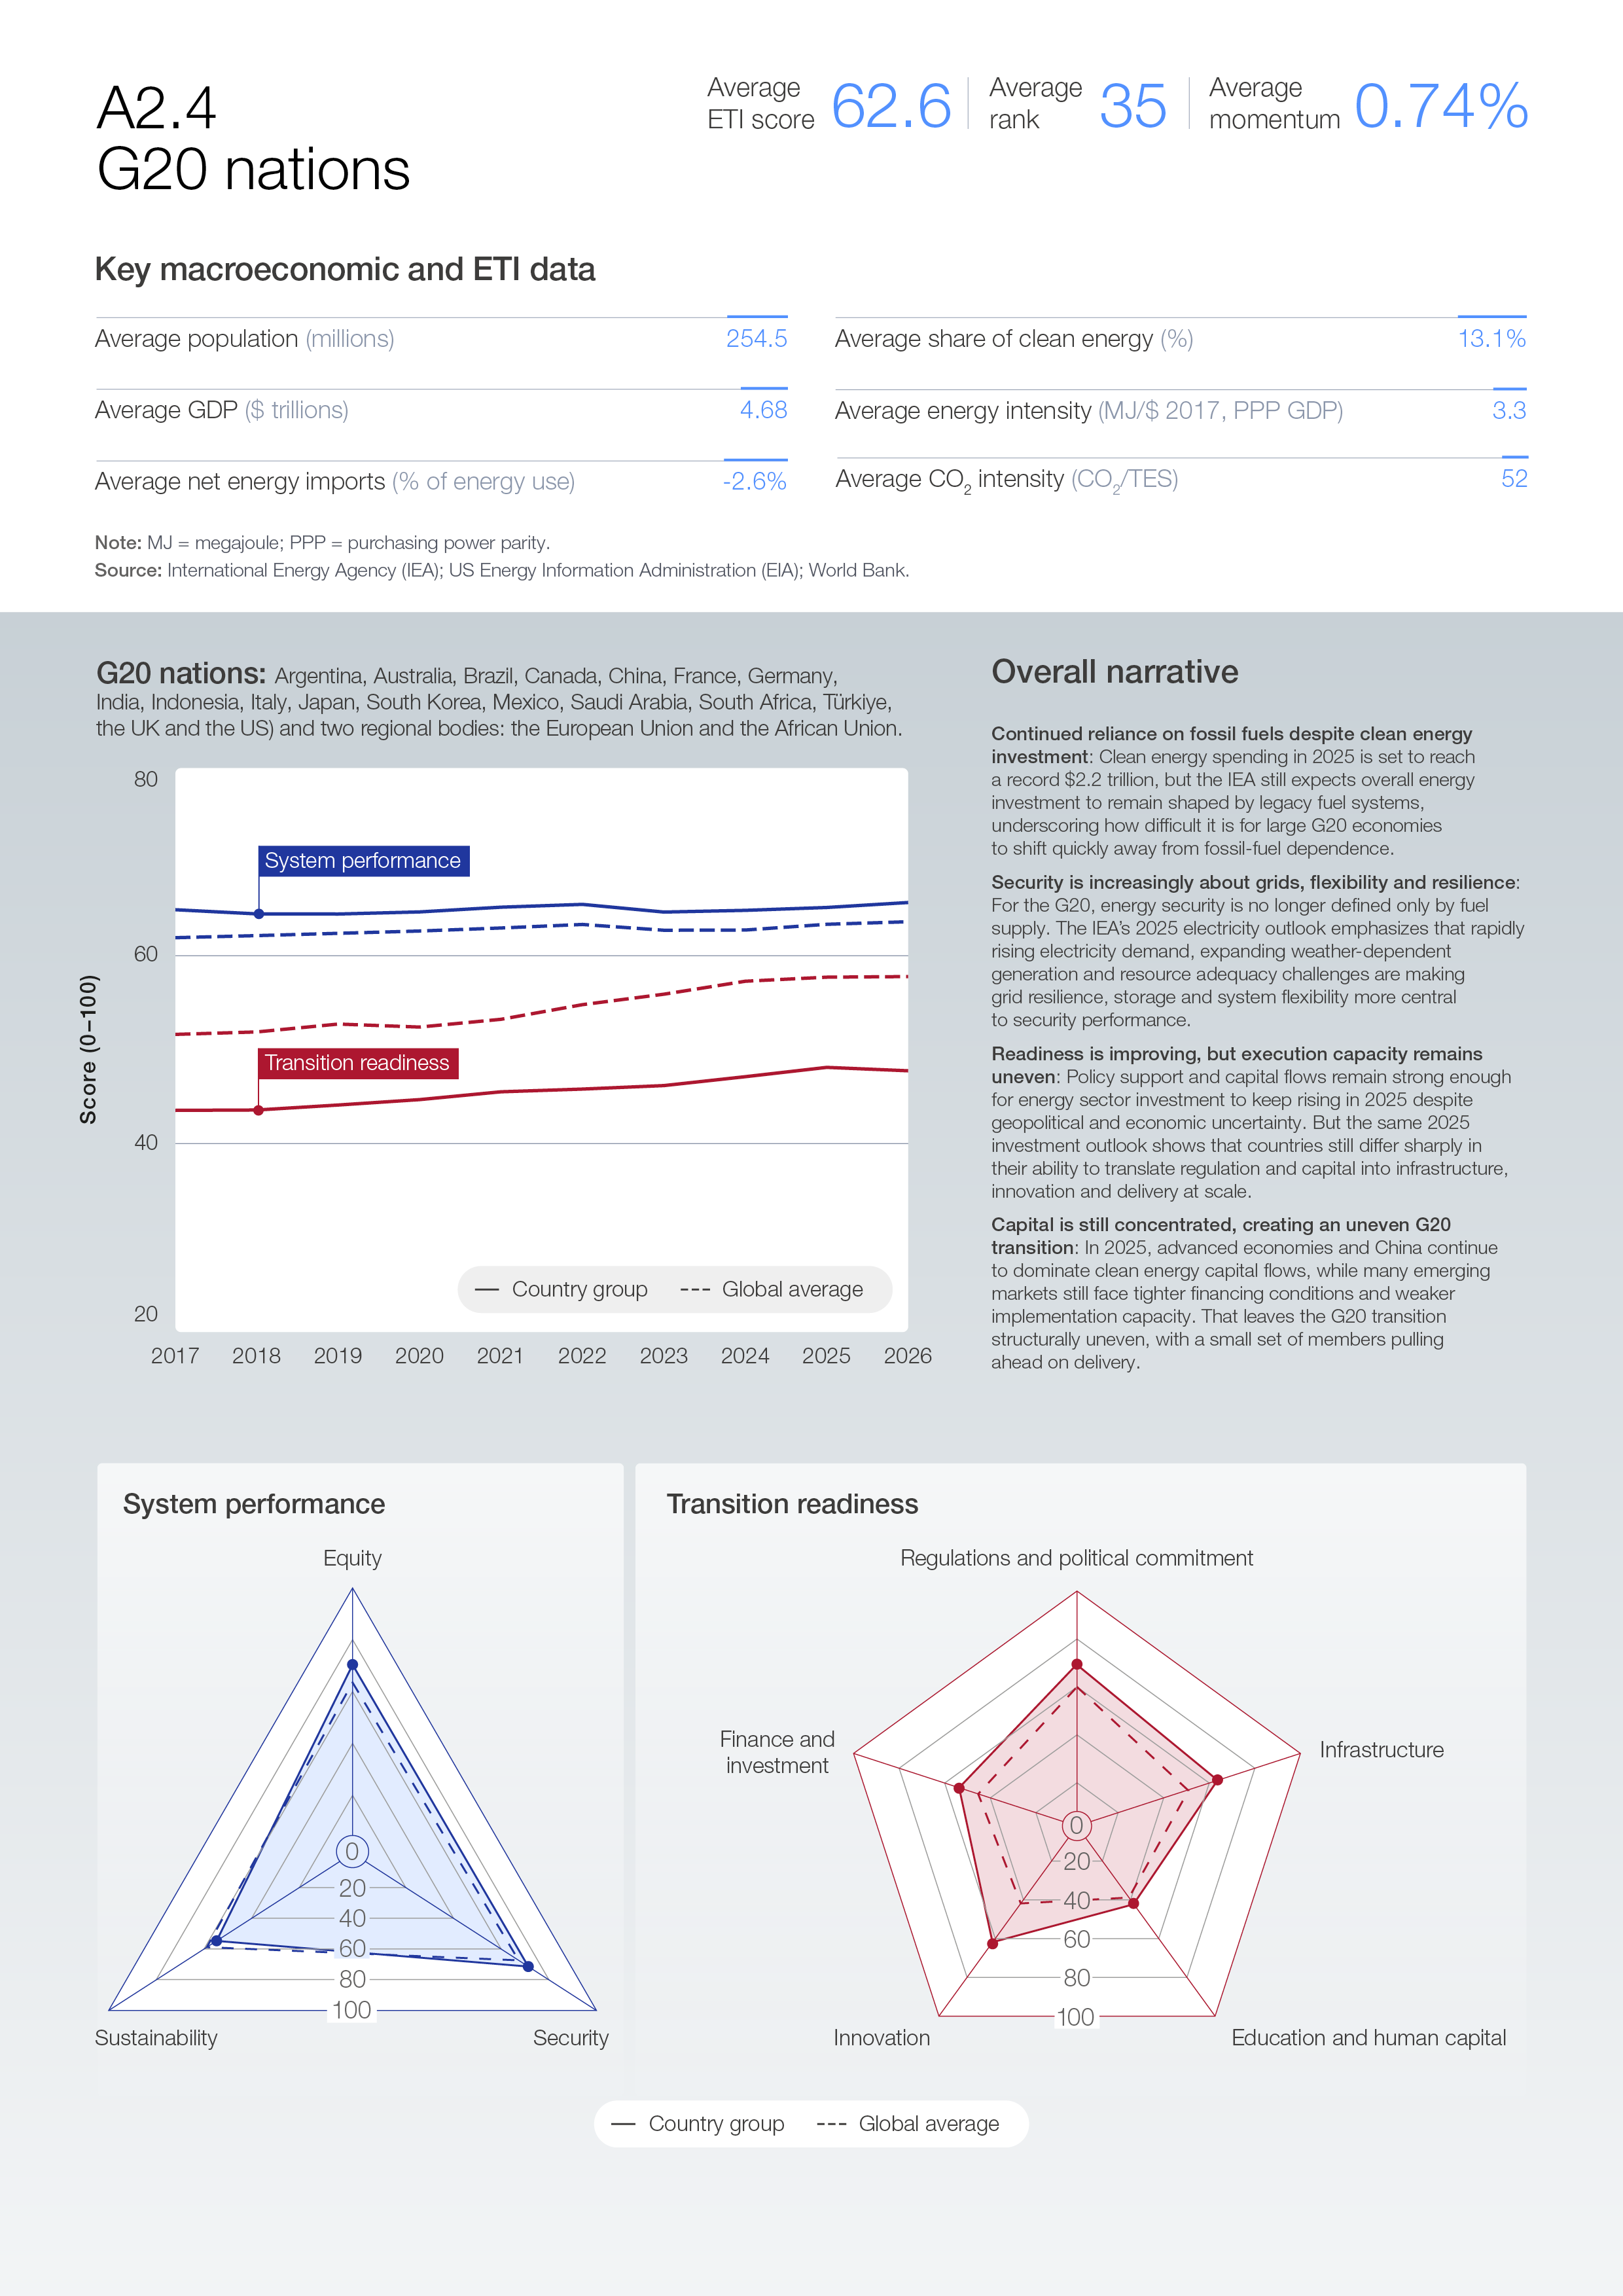
A2.4 G20 nations

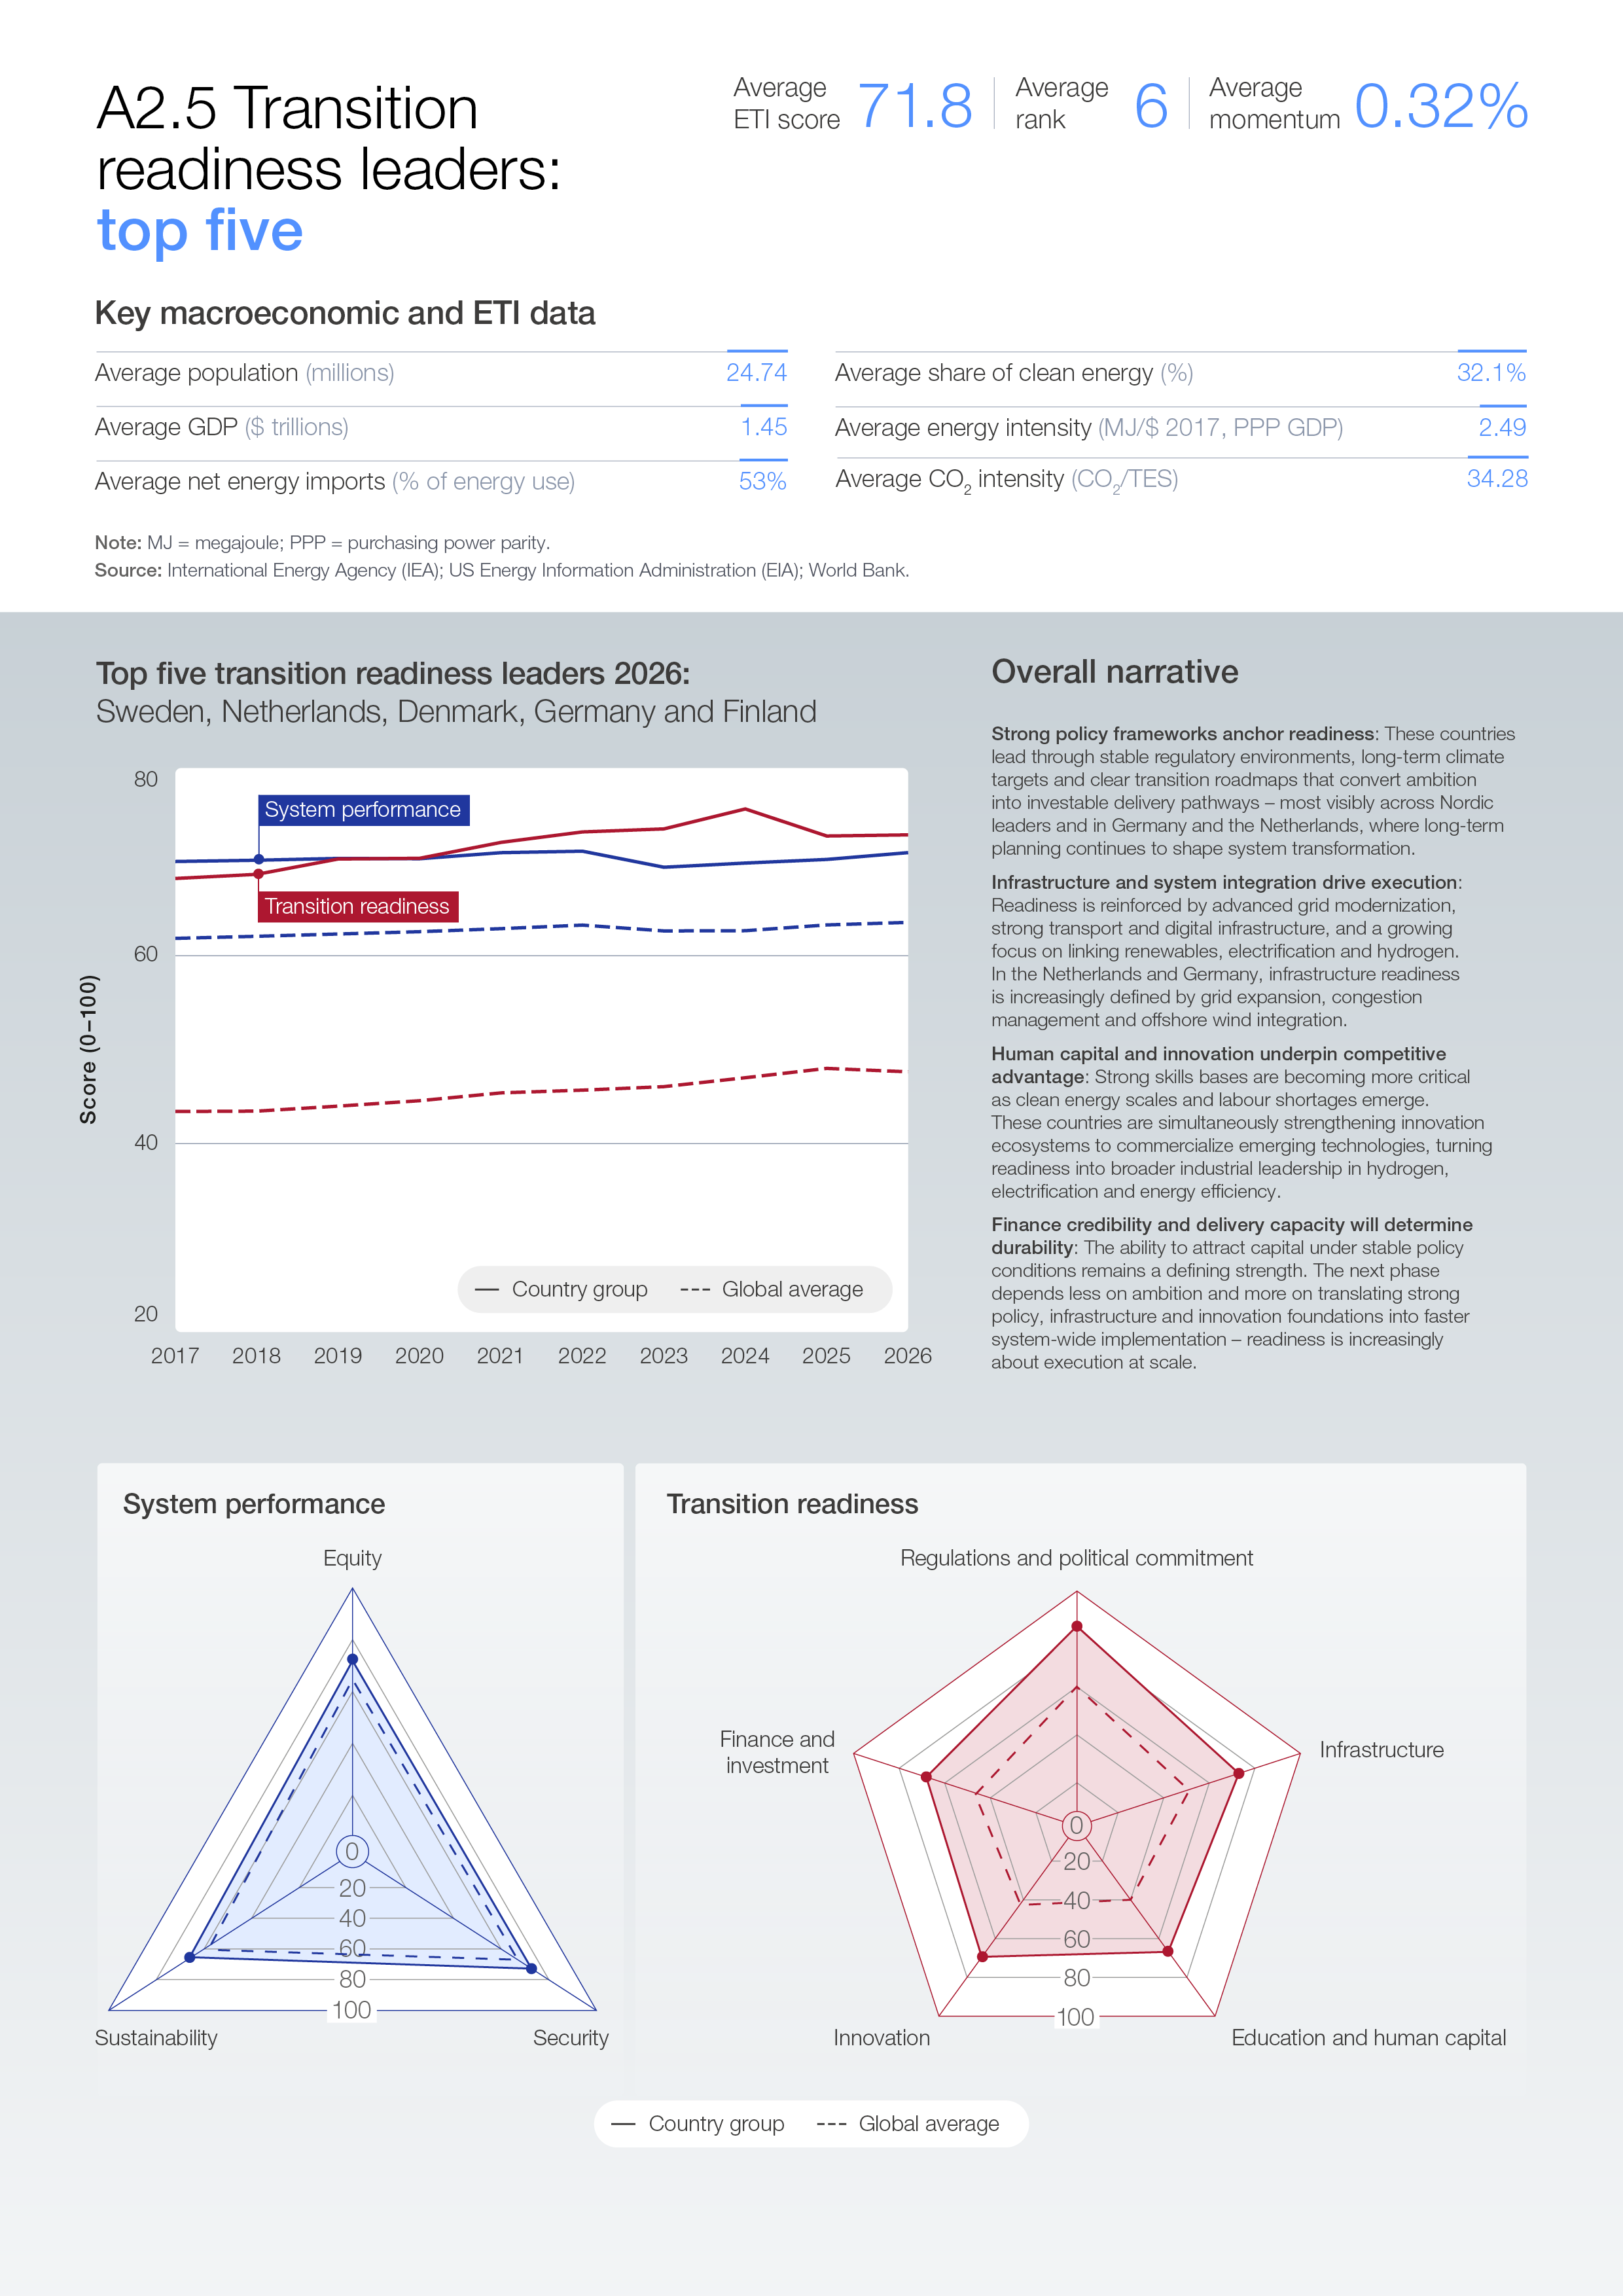
A2.5 Transition readiness leaders: top five

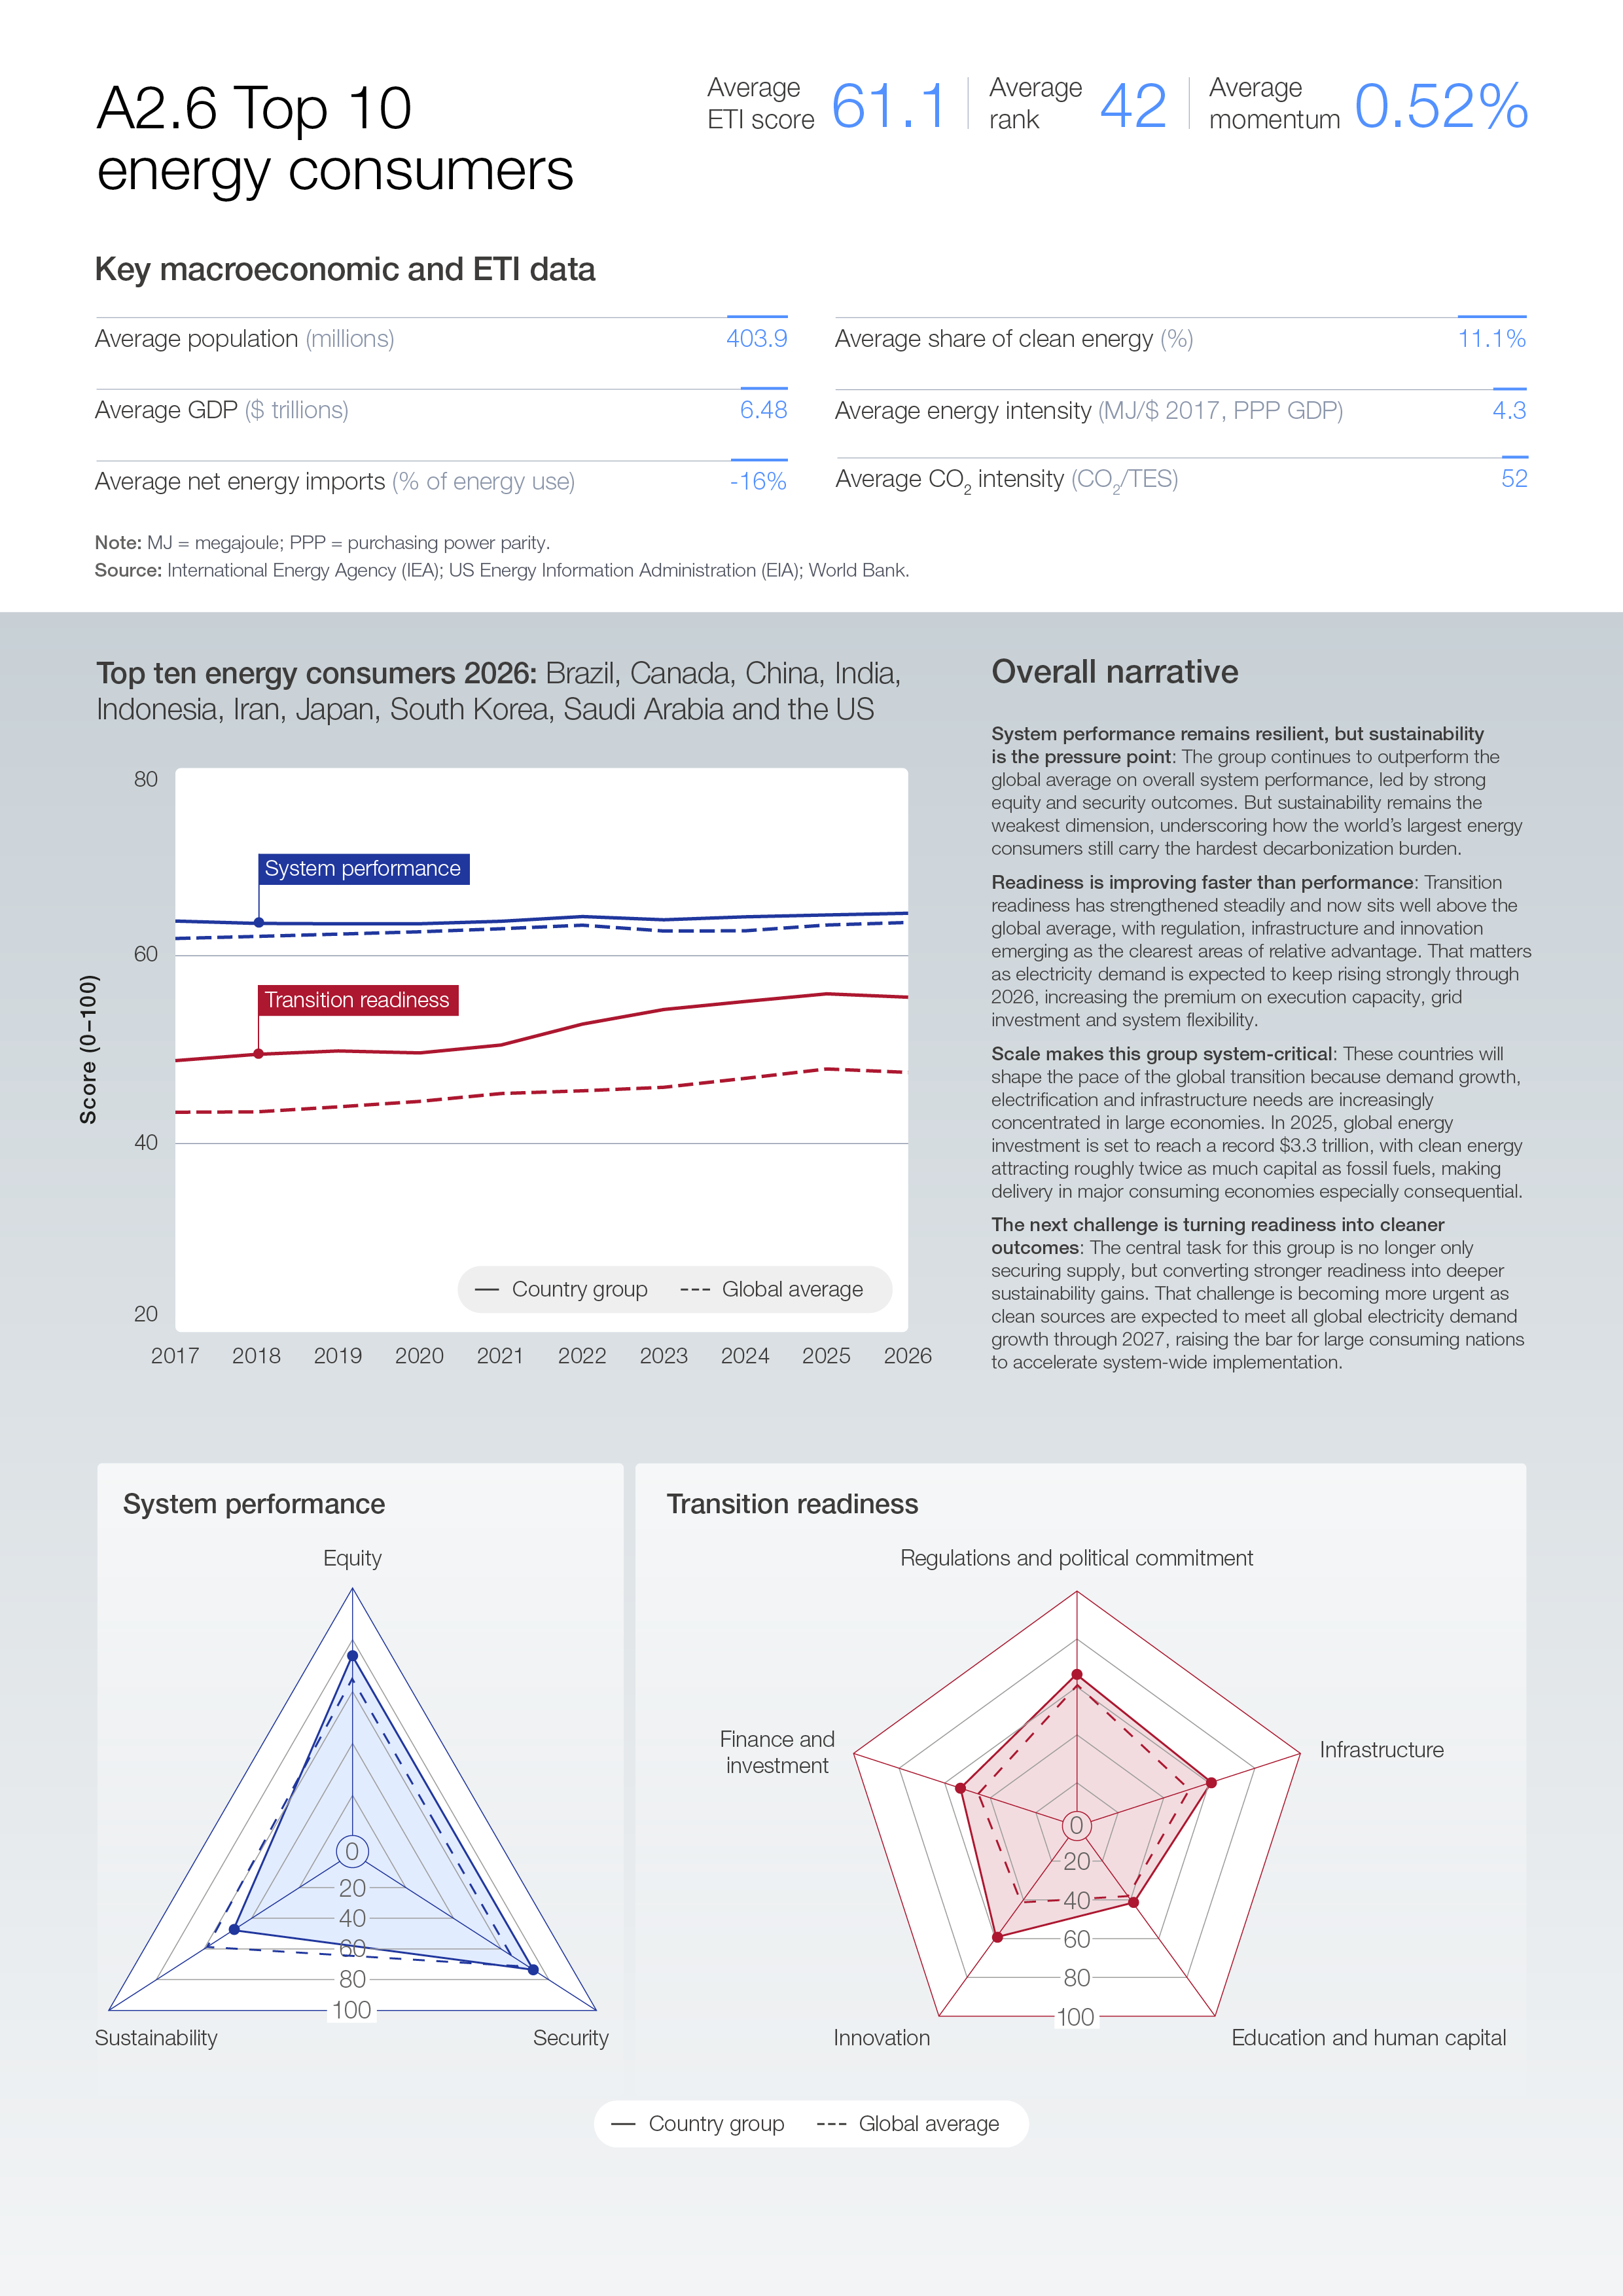
A2.6 Top ten energy consumers

A2.7 Energy supply leaders: top five