Energy Transition Index 2026


2. Overall results
The ETI signals that global energy transition progress has lost momentum, not because deployment is slowing, but because the conditions sustaining it are eroding.
2.1 Transition scores
Box 2: Transition scores – key takeaways
- Overall ETI progress has flattened in 2026, with average ETI scores broadly unchanged (+0.03%). This signals that transition progress is slowing as security risks, investment constraints and infrastructure bottlenecks intensify.
- System performance improved, driven by gains in equity and continued progress in sustainability, although the pace of sustainability improvements slowed. Average system performance rose by 0.43%, showing continued gains in current energy system outcomes, but at a more moderate pace.
- Transition readiness declined in 2026 for the first time in over a decade, reversing recent gains. Average readiness fell by 0.76%, weakening the enabling environment needed to sustain progress.
- The gap between ambition and delivery is widening. Despite record energy investment, factors such as tighter financial conditions, policy uncertainty and infrastructure constraints are limiting its impact on readiness.
Figure 2: Global average ETI and sub-index scores, 2017–2026
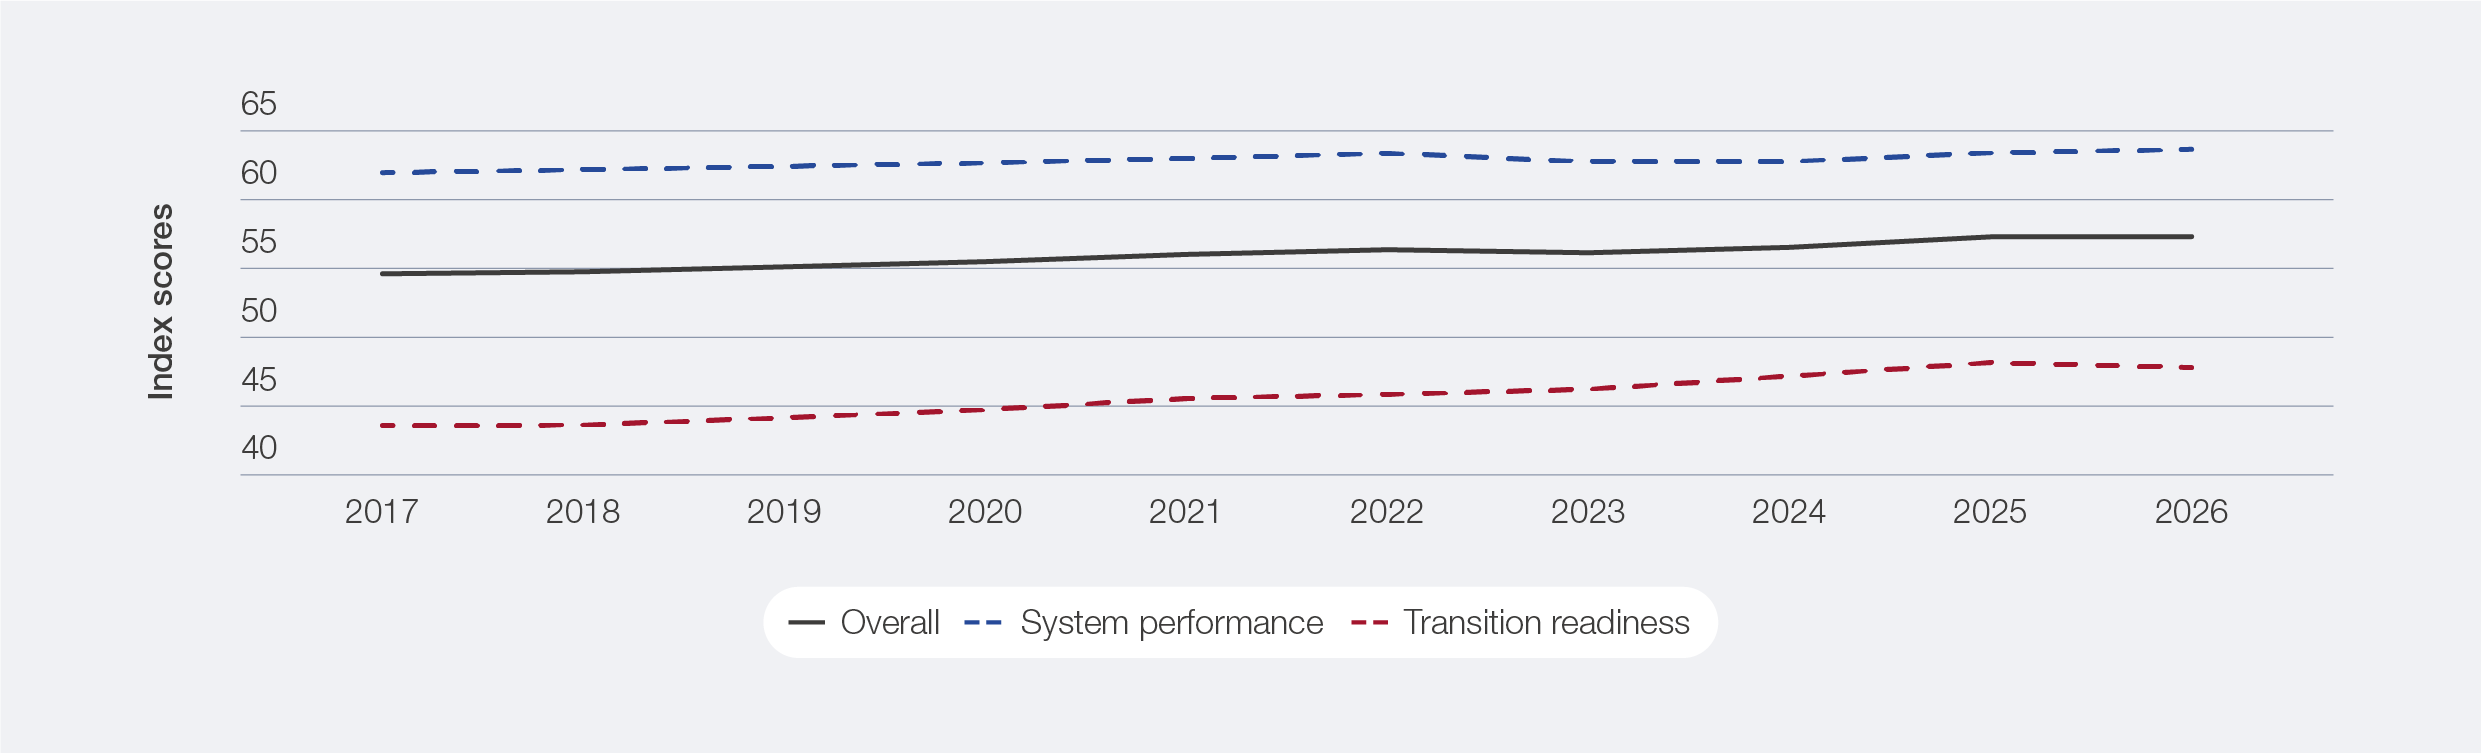

The 2026 ETI points to a stall in global transition momentum after the 2025 rebound. The overall score remained broadly flat (+0.03%), as continued gains in system performance (+0.43%) were offset by a decline in transition readiness (-0.76%). This divergence points to a key finding: energy systems are still delivering incremental improvements today, but the enabling conditions that shape progress are weakening. Higher financing costs, policy uncertainty, geopolitical fragmentation and delivery bottlenecks are making it harder to convert ambition into investment and execution. Four of the five readiness sub-dimensions deteriorated, with investment conditions and regulatory commitment declining most sharply. Countries that stabilize these enabling conditions while sustaining deployment will be better positioned to maintain transition progress.
Figure 3: ETI change decomposition: system performance and transition readiness
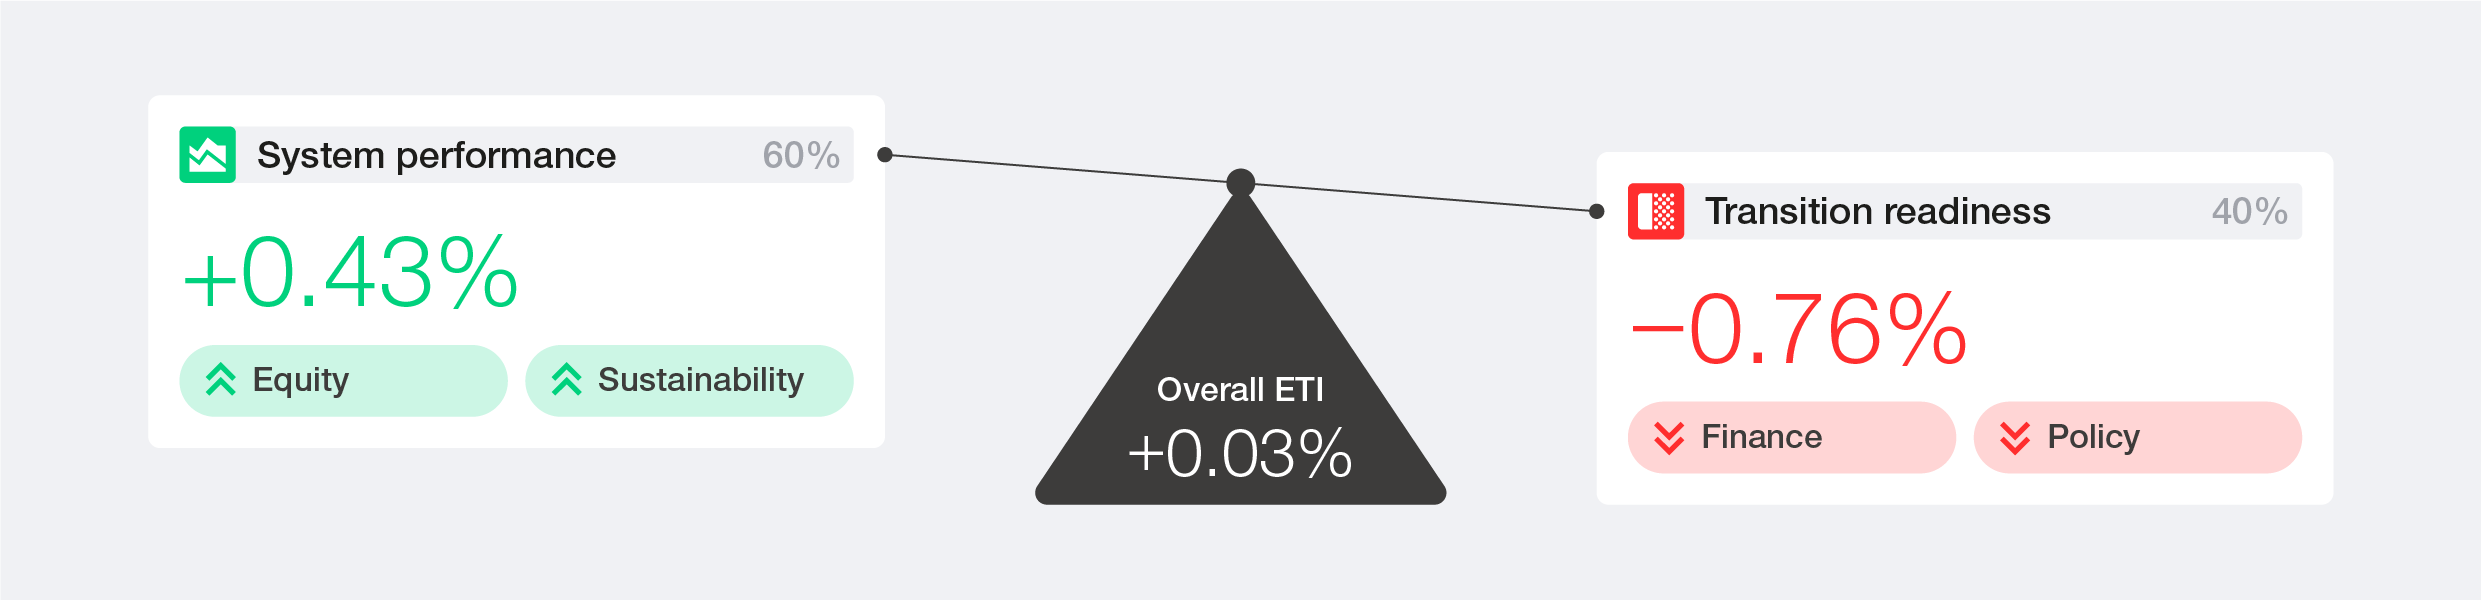

Energy system performance improved, driven primarily by gains in equity (+1.6%). Sustainability also improved (+0.6%), though at a slower pace, reflecting steady but gradual progress towards cleaner outcomes. In contrast, security declined (-0.9%), making it the only dimension to deteriorate. Although affordability pressures appear to have eased, geopolitical and macroeconomic tensions mean pressures on energy prices and household costs remain elevated. This suggests that recent affordability improvements are fragile and could reverse if external shocks persist or intensify. The immediate implications of the Middle East conflict underscored this risk, with sharp rises in gasoline (up 50% in the US in April since the start of the conflict9), diesel and natural gas prices (which surged up to 60% in Europe in March10) across major markets within weeks of the disruption. Energy security remains a key constraint on overall progress. Without stronger advancements, these system gains will be difficult to sustain, reinforcing security as a critical bottleneck to durable performance.
Transition readiness saw the first decline in over a decade. Finance and investment saw the sharpest decline (-1.8%). Although total clean energy investment reached a record $2.3 trillion, the ETI score fell as renewable investment dropped by 9.5%. Regulation and political commitment also weakened (-1.2%), primarily driven by rising policy instability. The decline was heavily present in advanced economies, including the US, the United Kingdom and the Netherlands, seeing reduced policy momentum, although some countries, including India, strengthened their support, largely in response to energy security and affordability concerns. Innovation declined (-1.1%), as a deterioration in green technology development and diffusion outweighed modest improvements in research and development (R&D) intensity and the broader business innovation environment. The diffusion of environment-related technologies – the primary structural driver of the score – has now fallen for a decade, raising concerns about the pace of future advancement. Infrastructure declined slightly (-0.2%), masking a more significant issue: despite record capacity additions, grid investment is lagging, with more than 2,500 GW of projects stalled in connection queues. Education and human capital was the only readiness dimension to improve (+2.0%), but these gains were not enough to offset broader declines across the system. These declines reflect an operating environment in which geopolitical fragmentation, supply chain concentration and rising execution complexity are eroding the conditions under which capital deploys, infrastructure delivers and policy holds.
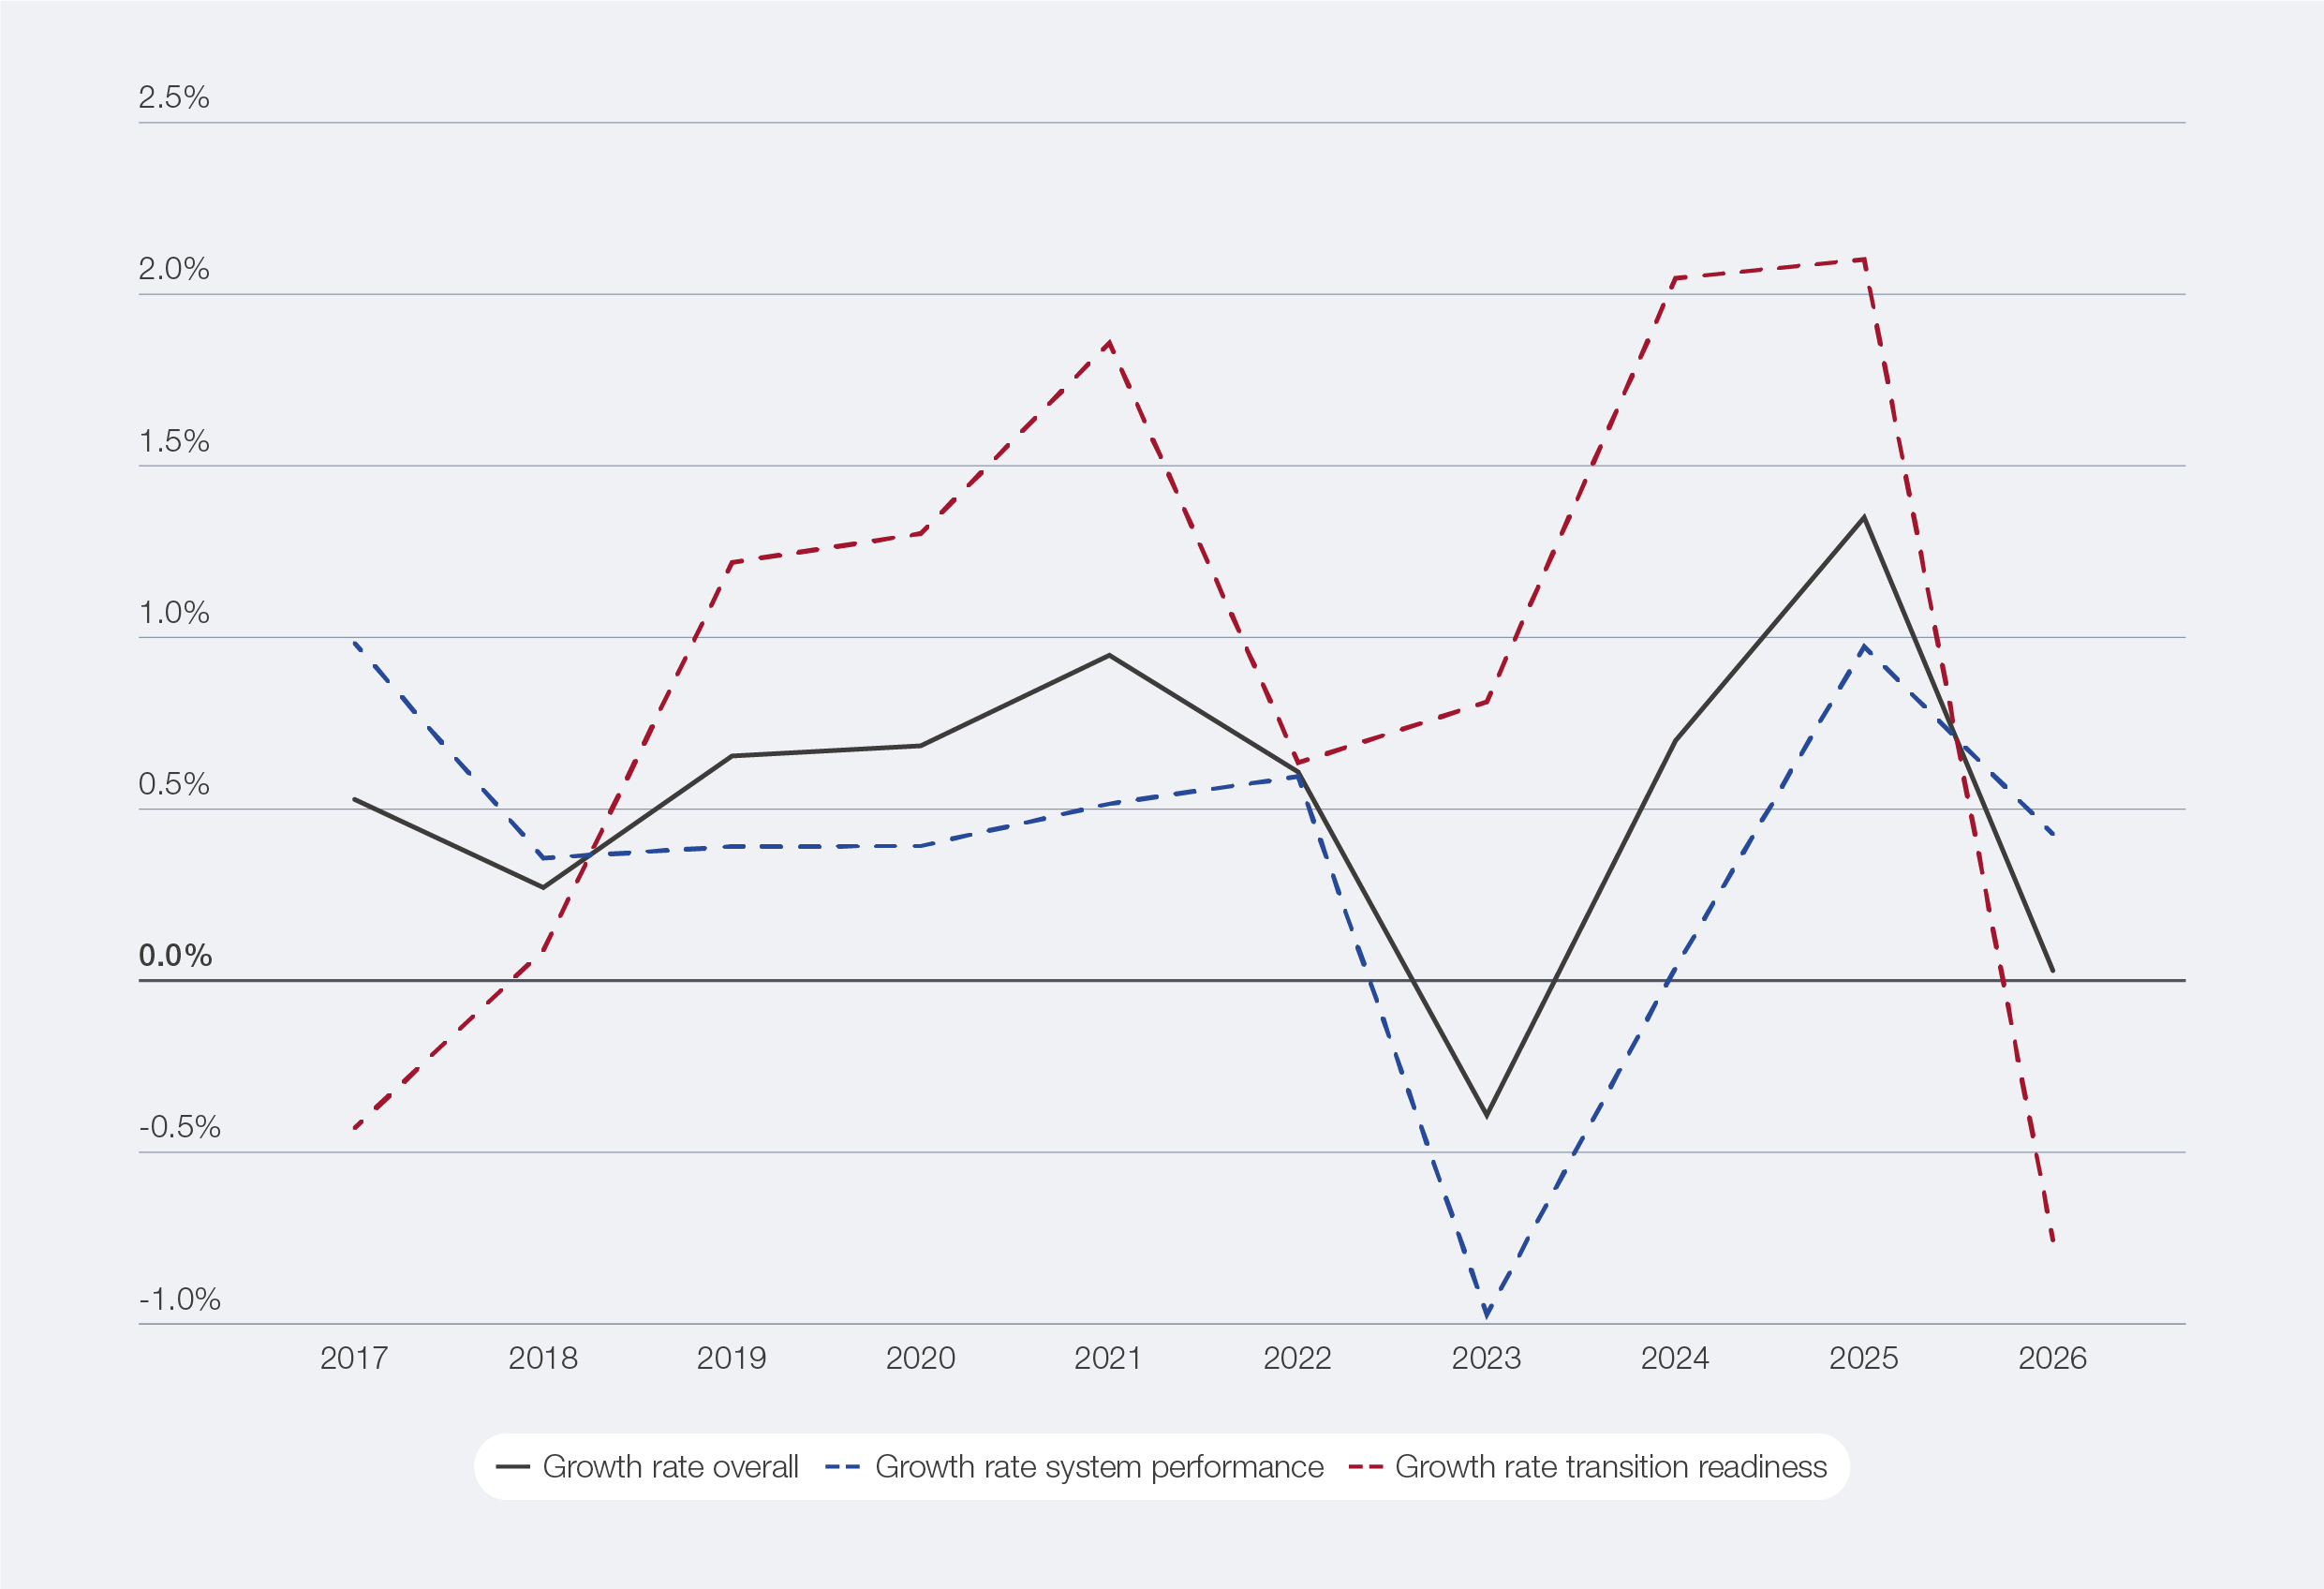
Figure 4: Global average sub-index and overall growth rates, 2017–2026

Box 3: Energy systems 2025–2026: context and trends
The 2025–2026 period marked a clear shift in the energy transition.
Several defining trends emerged in the last year:
– Energy security has reemerged as a dominant strategic priority. In 2025, geoeconomic confrontation overtook climate as the most severe short-term global risk.11 Trade restrictions, industrial rivalry and strategic fragmentation increasingly dictate policy, reinforcing supply resilience and domestic capability as core goals. By mid-2025, trade affected by these restrictions reached $2.64 trillion (triple 2024 levels), highlighting massive global economic fragmentation.12 Developments in early 2026 further entrenched this, as the Middle East conflict disrupted flows through the Strait of Hormuz. This critical chokepoint handles approximately 20 million barrels of oil per day (roughly a quarter of global seaborne oil) alongside one-fifth of global LNG trade.13 The resulting shock triggered the International Energy Agency’s (IEA) largest coordinated reserve release, pushing Brent crude oil past $100 per barrel to a historic multi-year peak, the highest since 2022, and surging gas prices.14 These disruptions caused economic knock-on effects and localized energy rationing. These exposed vulnerabilities are compelling governments and the private sector to rethink how to affordably bolster security and resilience.
– Electricity demand remains the energy system’s main pressure point. Growing by 3.0% in 2025, it outpaced overall energy demand.15 Emerging and developing economies drove roughly 80% of this growth, with China exceeding half.16 Meanwhile, advanced economies accounted for nearly 20% of global electricity demand, driven primarily by cooling, data centres, AI and EVs.17 Rising demand is clearly no longer just a developing market story; meeting it is now a defining constraint on the transition.
– Clean energy continues scaling, but fossil fuel displacement remains uneven. Renewable generation grew by 9% in 2025, outpacing the past decade’s 6.4% average, as global low-emissions sources virtually matched coal power. US coal consumption rose, but was offset by declines in India and China, marking the latter’s first drop in five decades.18 From a sustainability perspective, this underscores that progress is no longer just about adding clean capacity; it equally depends on actively reducing fossil fuel reliance and improving energy efficiency.
– Despite clean energy expansion, global GHG emissions hit a record 60.63 billion tons of CO2e19 in 2025, even as electricity CO2 intensity fell by 3% and power-sector emissions remained flat. Rising demand, increased fossil-fuel use and weather-driven consumption offset these clean energy gains. This underscores that, while clean energy is scaling, it remains too slow to drive sustained declines in absolute emissions.
– Critical minerals now anchor energy and industrial strategies. Yet supply remains concentrated, with China holding roughly 70% of key transition mineral refining capacity.20 By mid-2025, over half of energy-related minerals faced export controls, prompting over 20 countries to adopt formal strategies using public funding, domestic policies and international partnerships.21 Consequently, critical minerals are not mere transition inputs, but strategic assets shaped by geopolitics and supply-chain resilience.
– Capital remained available, but confidence became more selective. Global investment in the energy transition hit a record $2.3 trillion in 2025 (+8% increase YoY).22 However, 75% of this investment was concentrated in the US, China and Europe, highlighting persistent geographic imbalances. Mature technologies dominated, but hydrogen ($8 billion, +80% YoY) and CCUS (over $5 billion) also gained traction. Ultimately, capital deployment is increasingly dictated by risk, policy certainty and bankability.23
– AI and digitalization became material drivers of infrastructure demand. Global AI spending hit $1.5 trillion in 2025 (+50% YoY), with AI-optimized infrastructure investments nearly doubling.24 This translates into rapidly growing electricity demand from data centres, reinforcing digitalization as both a key demand driver and a source of system stress. The scale and reliability requirements of this demand are accelerating the urgency around deploying flexibility solutions, storage, demand response and grid-enhancing technologies while also reviving interest in nuclear energy as a source of firm, clean baseload power. Microsoft,25 Google26 and Amazon27 have all signed advanced nuclear partnerships to secure firm, clean electricity for AI growth. This signals that large consumers are increasingly shaping generation and infrastructure investment to meet their own reliability needs, rather than waiting for system-wide solutions to catch up.
– Innovation is shifting from technology development to system deployment. Solar photovoltaic (PV), wind turbine and battery costs have fallen to record lows, with the IEA’s price index down 60% over the past decade,28 and electrification is now anchoring the next phase of system transformation, with energy technology patent volumes and investment both rising steadily.29 AI applications, from predictive maintenance to advanced forecasting and grid optimization, alongside new business models, market mechanisms and financing tools, are starting to deliver system value across diverse contexts.30 The frontier has moved from generation technology to system integration, flexibility and grid management. Progress now depends less on invention than on scaling proven approaches more widely, supported by coherent market, regulatory and financing frameworks that reward adoption at pace.
– Emerging economies are central to future transition outcomes. Driving roughly 80% of demand growth, these markets will shape the transition’s next phase.31 Their capacity to mobilize capital, expand infrastructure and scale clean energy will dictate whether or not global progress broadens, shifting focus from technology costs to financing, delivery and industrial capability.
Box 4: Country trends and regional insights – key takeaways
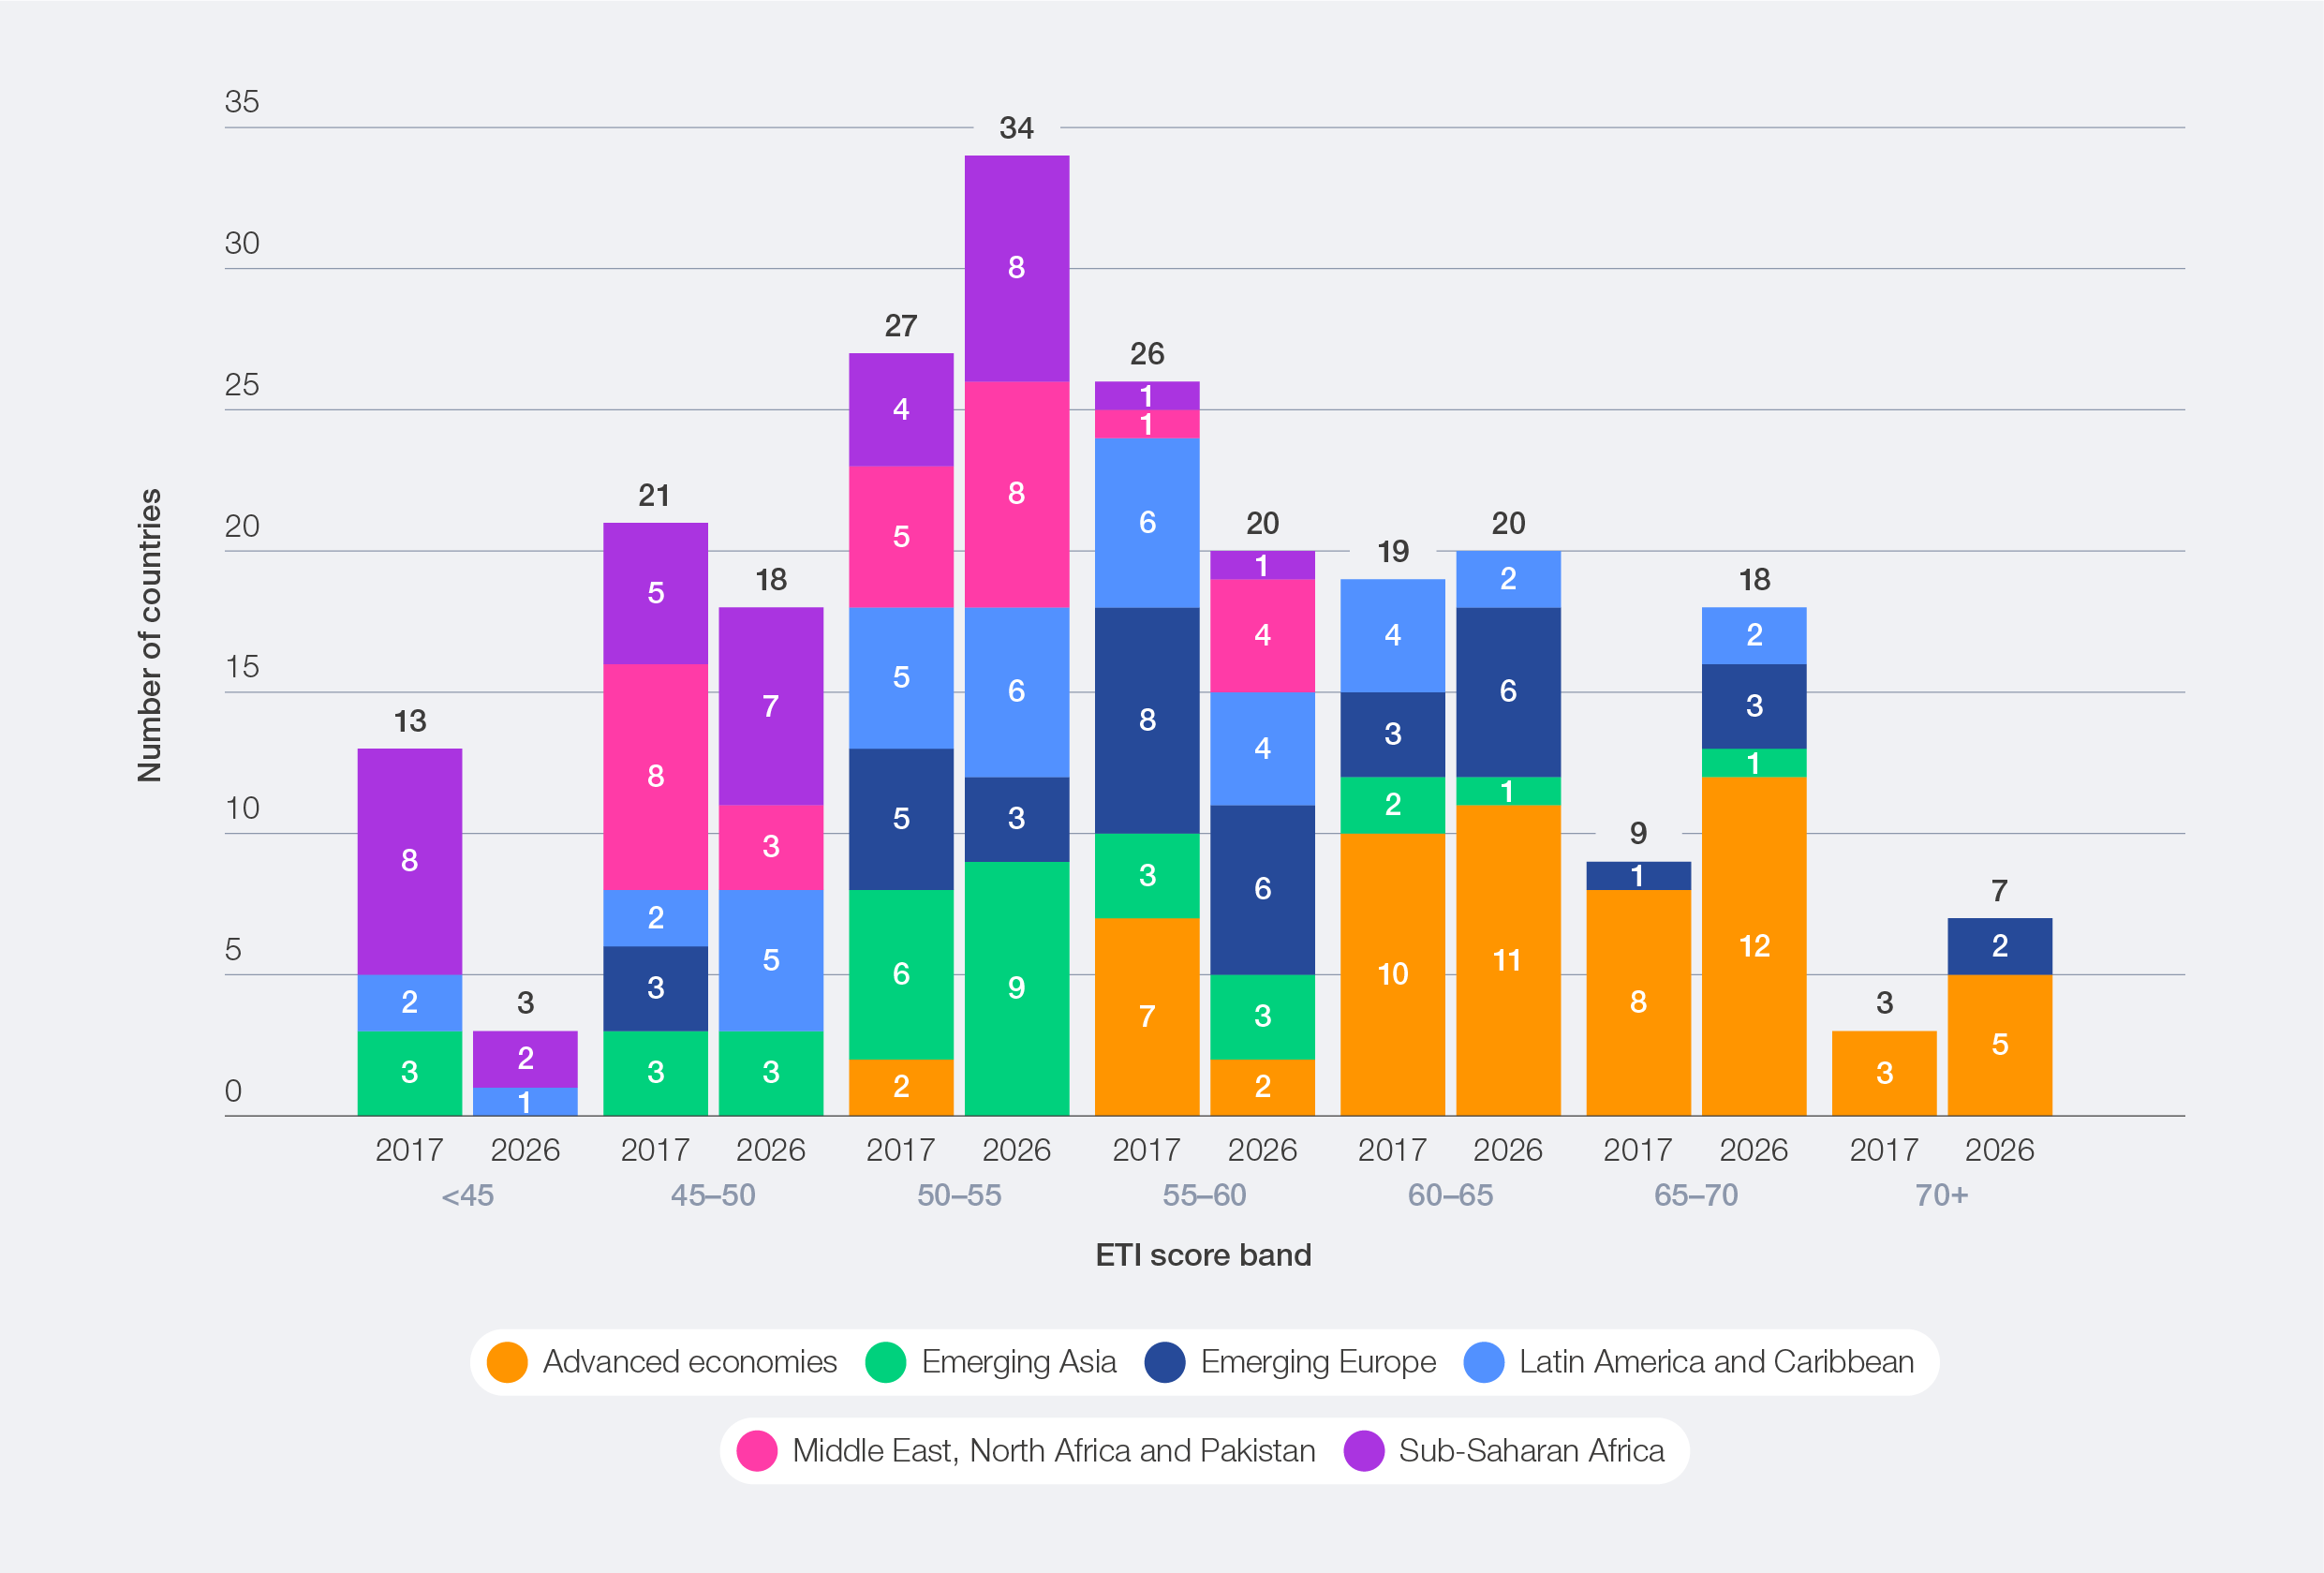
– Country progress is increasingly mixed as sustaining transition momentum becomes more challenging. In 2026, 56% of countries improved their ETI scores, reflecting slower and uneven progress amid rising pressures on energy systems. Only 24% advanced in all three system performance areas, and very few improved across all five transition readiness parameters.
– Transition readiness is emerging as the main constraint on future progress. With transition readiness declining in 43% of the countries, sustaining progress depends on strong policy frameworks, infrastructure, skills and investment conditions.
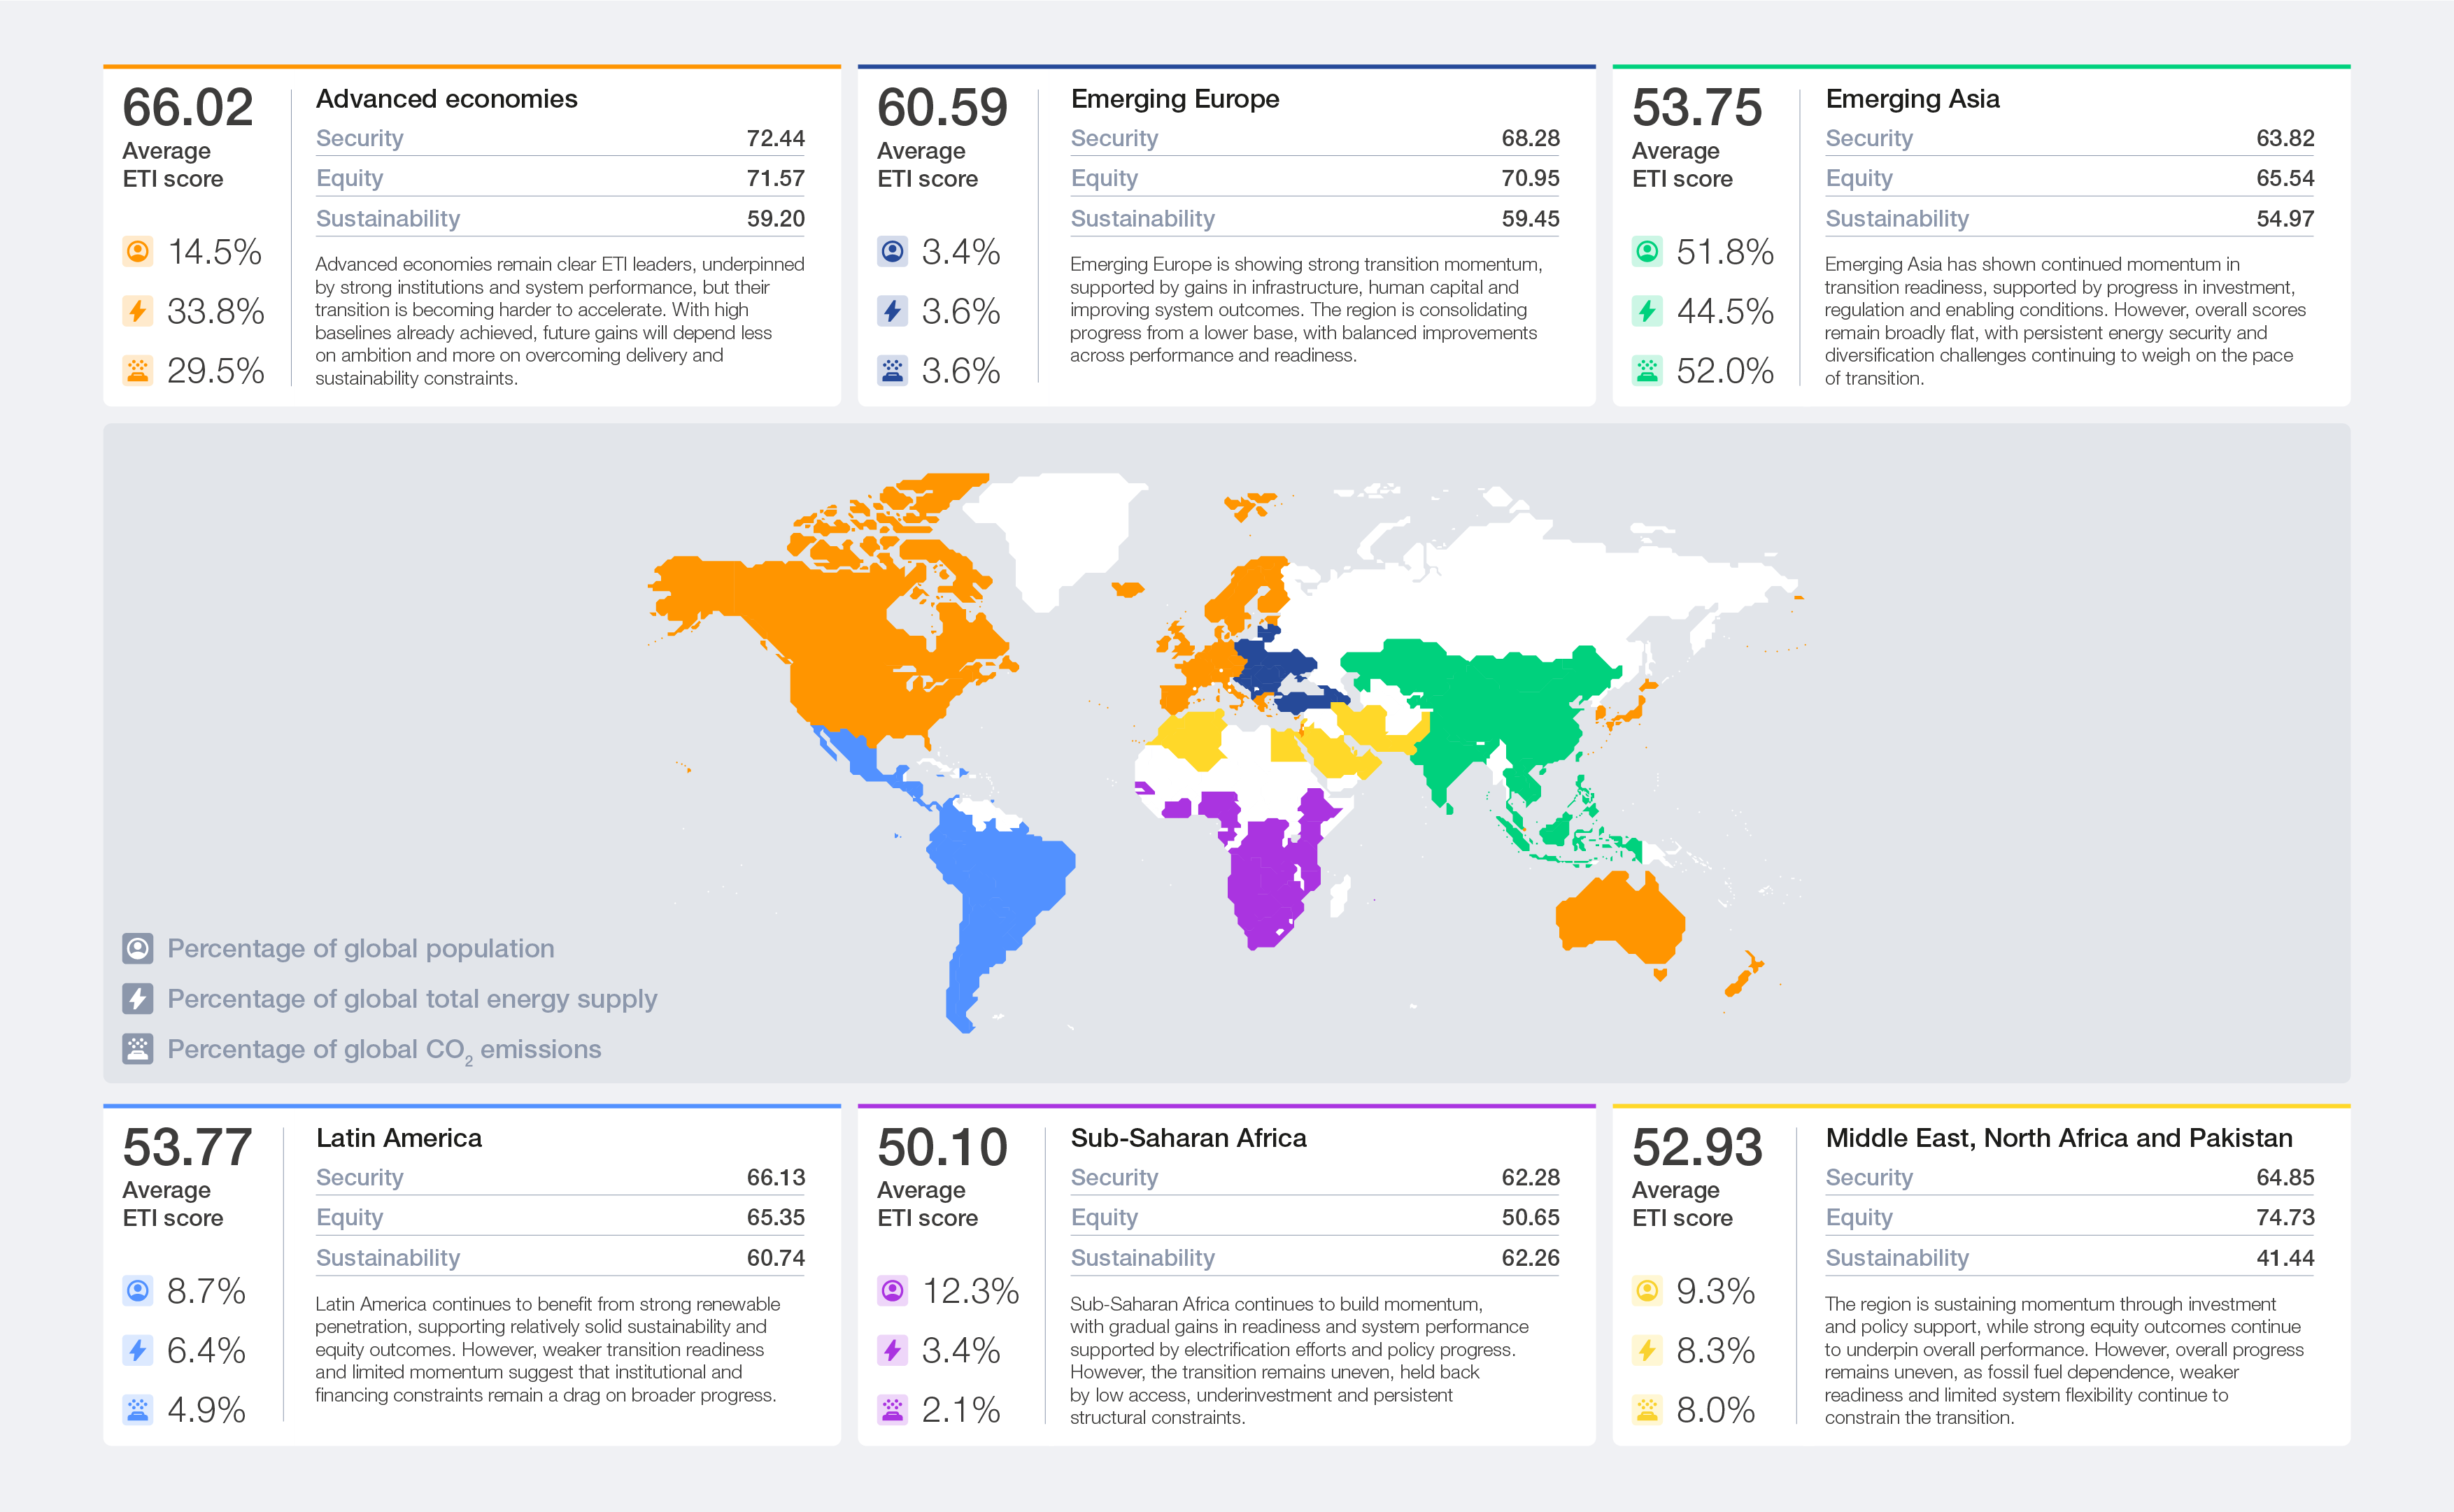
– The transition remains multi-speed and shaped by regional strengths. Advanced economies show strong performance overall and conditions that enable transition readiness, supported by equity and sustainability gains and overall higher readiness (infrastructure) baselines. Other regions are progressing through distinct advantages; the Middle East, North Africa and Pakistan excel in equity due to abundant domestic resources and pricing policies that ensure high affordability. Meanwhile, Latin America and Sub-Saharan Africa score highly in sustainability, benefiting from extensive hydropower infrastructure and lower baseline carbon intensity. Substantial differences within groupings underline that no single pathway exists.
– Top performers remain resilient, but leadership is increasingly contested. Advanced economies and Nordic countries are still anchored in the top rankings, underscoring the value of institutional strength, policy consistency and system readiness. Meanwhile, a growing number of emerging and developing economies are improving through targeted gains in infrastructure, investment and enabling conditions, proving rapid progress is possible beyond the traditional leaders.
Table 1 outlines the 2026 ETI rankings. Advanced European economies anchor the top 20, alongside China (14th), the US (19th) and Brazil (17th). Their outsized impact on global demand, investments and emissions makes their transitions critically important.
Table 1: ETI ranking table 2026

Box 5: Reading rank movements across years – key takeaways
YoY ranking changes should be interpreted with caution given that the ETI is a relative index, with many countries separated by small score differences. Consequently, rank shifts may reflect marginal indicator changes or faster peer progress, rather than fundamental changes in a country’s transition performance.
Therefore, a country’s long-term score trajectory provides a more reliable view of underlying progress than short-term rank movements:
China has strengthened its position over the longer term, with its ETI score rising from 61.1 in 2017 to 66.9 in 2026. China improved across every dimension of the energy system; energy intensity fell sharply, clean energy’s share of generation nearly doubled, and affordability strengthened. This was supported by sustained industrial policy, tightening efficiency standards32 and clean energy investment that grew to $800 billion over the decade.33
Portugal recorded strong multi-year progress, with its ETI score rising from 59.2 in 2017 to 66.7 in 2026. This was anchored in deliberate policy sequencing, such as a binding coal phase-out (completed 2021), competitive renewable auctions that have driven solar energy capacity up by 440% since 201734 and an updated National Energy and Climate Plan (NECP) that raised the renewable electricity target to 93% by 2030 and brought forward the climate neutrality deadline to 2045.35 Renewables rose from 51% to 71% of electricity over the decade.
Lithuania has also made steady long-term progress, with its ETI score rising from 60.5 in 2017 to 65.5 in 2026. This transformation was driven by its National Energy Independence Strategy, which prioritized domestic energy generation, efficient permitting reforms that cut renewable approval timelines and a net-metering system that rapidly scaled the amount of distributed solar energy.36 Wind and solar went from negligible to 65% of electricity in under a decade.37
In 2026, the pace of country-level energy transition has become more uneven. A total of 67 countries (56%) improved their overall ETI scores, while 53 (44%) declined. Countries that improved did so by an average of 2.8%, partly offset by an average decline of 1.7% among those that moved backwards. Only 34 countries (28%) improved by more than 1 point, while 18 (15%) declined by more than one point, showing that score changes were relatively concentrated rather than broadly distributed. The introduction of two new indicators of “AI readiness” and “critical minerals supply chain exposure” had a negligible effect on country scores, reducing the global average by just 0.03%.
Advanced economies continued to dominate the rankings, accounting for 14 of the top 20 performers, with overall scores rising modestly (+0.2%). Gains in equity, sustainability, education and human capital, and infrastructure helped offset weaker security, financial investments and policy commitment. Nordic countries remained prominent, with Sweden, Finland and Denmark holding the top three positions. Progress within the top tier was mixed, with some countries improving while others saw slight declines due to weaker readiness. Singapore was a standout, rising 10 places on stronger policy signals, while the US slipped slightly despite a strong performance in security. Japan improved marginally, and Germany maintained its position with steady gains.
Latin America and the Caribbean saw a 0.5% decline in overall ETI scores, driven by weakening transition readiness, particularly in infrastructure, regulation and innovation. Brazil remained the regional leader, supported by its structurally clean power mix, strong biofuels sector and expanding renewable pipeline. Its established approach to transmission investment, using competitive auctions and long-term contracts, has helped attract private capital and address grid constraints.
Emerging Asia remained broadly flat, with a slight 0.1% decline, as gains in infrastructure and education were offset by weaker security, innovation and financial investment. China remained the region’s top performer, investing $627 billion in clean energy in 2025 and continuing to expand renewable capacity at scale. Improvements in affordability, energy intensity and infrastructure were partially offset by a more challenging regulatory and investment environment. India also stood out, recording one of the greatest improvements in readiness, driven by significant gains in infrastructure and human capital, positioning it as a key player in the next phase of the transition.
Emerging Europe strengthened, with overall ETI scores rising by 0.7%; Estonia, Latvia and Romania all placed in the top 20. The improvement was driven by stronger system performance, particularly in equity and sustainability, even as readiness stagnated, with gains in education and human capital offset by declines in innovation. Estonia led the region, with gains across both performance and readiness, supported by improvements in equity and finance and investment.
Sub-Saharan Africa recorded the greatest regional improvement, with ETI scores rising by 1.2%. Progress was supported by gains across both system performance and readiness, particularly in education, innovation and financial investment. Namibia contributed to this trend, with its score rising on the back of improved readiness.
The Middle East, North Africa and Pakistan declined by 0.9%, reflecting weakening performance and readiness. Despite this, Saudi Arabia stood out, improving its ranking through stronger financial backing, accelerated renewable deployment and investments in large-scale battery storage.
Regional trajectories are diverging; progress depends on matching system gains with readiness. Still, diverse countries can drive rapid gains through targeted, context-specific efforts. Figure 6 highlights illustrative cases chosen to reflect a mix of top performers, major economies, strong movers and regional shapers.
Figure 5: Regional scores and key insights 2026
![Note: “TR” refers to “transition readiness”; “SP” refers to “system performance”. Brackets indicate whether boundary values are included or excluded: [ ] means included; ( ) means excluded.](https://assets.weforum.org/editor/responsive_large_webp_imRpYqqmCClaOfJ4H6AdXXuWMk-6mROlcFcpfMSoh8o.webp)
Figure 6: Select countries performance insights in the ETI, 2026

These diverse pathways illustrate that progress is possible from many different starting points, but sustaining it will depend on how well countries navigate the shifting pressures ahead. Box 6 outlines the forces that will shape whether current momentum holds or erodes.
Box 6: Middle East conflict: implications for the energy transition
The Middle East conflict that began in early 2026 affects the energy transition in phases, with the earliest impacts already visible in traded fuel markets and later effects expected to feed through to prices, investment and system structure.
Short-term impact (within the first two months from the onset of the conflict)
Aspects with direct exposure to traded fuel markets, shipping routes and supply risk, including wholesale gas prices, net fuel imports and diversification of import counterparts experienced immediate and pronounced volatility.
Medium-term impact (three to six months from the onset of the conflict – impacts materializing across energy markets)
As higher energy costs have fed through the system, their effects are becoming more visible across affordability, fiscal and investment areas.
- Household and industry electricity prices: Increasing as higher feedstock and operating costs put pressure on electricity prices
- Energy subsidies: Coming under pressure as governments intervene to cap price increase, shielding households and industry from the direct impact of the supply shock
- Investment in renewable energy: Becoming more selective as risk perception increases and the cost of capital rises (though this could be region-dependent, as some markets see electrification as a solution to dependence on fossil fuel import)
- Demand disruption and consumption patterns: Shifting as fuel rationing and emergency demand-management measures in exposed markets temporarily reshape energy use, fuel mix and load profiles
Long-term impact (post six months from the conflict’s onset)
In the event of continued energy price volatility and market disruptions, impacts are likely to increasingly reshape structural aspects of energy systems as countries adapt to strengthen security.
- Diversity of total primary energy supply: Likely to improve over time as countries diversify fuel sources and reduce dependence on concentrated supply routes
- Renewable capacity build-out: May strengthen as countries accelerate renewables and electrification as a security response to reduce import dependence

Figure 7: ETI regional score shift over 10 years

The decade-long view suggests that regions with stronger policy coordination and shared regulatory frameworks, such as the EU-aligned economies, tended to converge, with laggards narrowing the gap over time. Sub-Saharan Africa rose broadly from a low base, driven primarily by strengthening regulatory environments and improved equity through expanding energy access and affordability.
Latin America’s spread widened; declining investment conditions and weakening energy security weighed on the region overall, while a few countries with stable frameworks and resource advantages continued to advance. This suggests that without coordinating mechanisms, transition progress tends to concentrate rather than diffuse.
Figure 8: Regional performance snapshot