Global Risks Report 2026


Appendix B
Global Risks Perception Survey 2025-2026
The Global Risks Perception Survey (GRPS) is the World Economic Forum’s source of original risks data, harnessing the expertise of the Forum’s extensive network of academic, business, government, international organization, civil society and other decision-makers and thought leaders. Survey responses were collected from 12 August to 22 September 2025.
Updates to the GRPS 2025-2026
The list of 33 global risks included in the survey was updated in 2025 as follows:
- “Cyber espionage and warfare” has been renamed “Cyber insecurity” to update and clarify the risk for respondents.
To ensure comparability over time, the fundamental concept of each risk has remained broadly consistent with that of previous versions of the survey.
Methodology
The GRPS 2025–2026 was further refined this year to gather more granular perceptions of risk and to incorporate new approaches to risk management and analysis. To that end, the GRPS 2025–2026 comprised six sections:
- Current risk landscape asked respondents to select one risk among 33 pre-selected global risks that they believe is most likely to present a material crisis on a global scale in 2026. The final rank is based on a simple tally of the number of times a risk was identified. This has remained the same as last year. The 33 risks are listed in Appendix A above. Respondents were also able to explain their reasoning in an additional free-text field. Results are illustrated in Chapter 1, Figure 2.
- Short- and long-term risks landscape asked respondents to estimate the likely impact (severity) of each of the 33 global risks, on a 1-7 scale [1 = Low severity, 7 = High severity], over both two-year and 10-year periods. “Severity” is meant to take into consideration the impact on populations, the economy or environmental resources on a global scale. Respondents were also allowed to nominate any other risk considered missing from the 33 risks. A simple average based on the scores selected was calculated and the results are illustrated in Chapter 1, Figure 10.
- Consequences seeks to understand the potential consequences of risks, to create a network map of the global risk landscape. Respondents were provided with 10 randomly selected global risks (from the full list of 33 global risks) and were then asked to select up to five global risks (from the full list) likely to be triggered by each of the 10 randomly selected risks. Results are illustrated in Chapter 1, Figure 6. In visual results, “Nodes: Risk influence” is based on a simple tally of all bidirectional relationships identified by respondents. “Edges: Relative influence” is based on a simple tally of the number of times the risk was identified as a consequence. However, visual results do not show all connections: weaker relationships identified by less than 25% of respondents were not included as edges.
- Risk governance asked respondents to identify approach(es) that they expect to have the most potential for driving action on risk reduction and preparedness over the next 10 years, with respect to the most severe risks (severity score of 6 or 7 over the 10-year timeframe). Respondents could choose among the following nine approaches: Financial instruments (e.g. insurance, catastrophe bonds, public risk pools); National and local regulations (e.g. environmental, operational or financial regulations and incentives); Minilateral treaties and agreements (e.g. Basel, Wassenaar, regional free trade agreements); Global treaties and agreements (e.g. United Nations Framework Convention on Climate Change [UNFCC], Paris, Montreal, Nonproliferation Treaty [NPT], World Trade Organization [WTO]); Development assistance (e.g. international aid for disaster risk response and reduction); Corporate strategies (e.g. environmental and social governance [ESG] reporting, resilient supply chains, social initiatives, public-private partnerships [PPPs]); Research and development (e.g. new technologies, early-warning systems, global risk research); Public awareness and education (e.g. campaigns, school curricula, media products); Multistakeholder engagement (e.g. platforms for exchanging knowledge, best practices, alignment). A simple tally of the number of times an approach was identified was calculated for each risk. To ensure legibility, the names of some of the global risks have been abbreviated in the figures. The portion of the full name used in the abbreviation is in bold in Table A.1.
- Risk outlook asked respondents to characterize the evolution of the global risks landscape based on a number of factors. It first asked respondents to select a statement that they believe best characterizes the global political environment for cooperation on global risks in 10 years. Respondents were provided with four options: (1) Reinvigoration of the US-led, rules-based international order; (2) Multipolar or fragmented order in which middle and great powers contest, set and enforce regional rules and norms; (3) Bipolar or bifurcated order shaped by strategic competition between two superpowers; (4) Realignment towards a new international order led by an alternative superpower. Please note that option (1) was changed from “Continued or reinvigoration of the US-led, rules-based international order” from last year. A simple tally for each of the four options was calculated. Results are illustrated in Chapter 1, Figure 9.
- Finally, respondents were asked to select a statement that best characterizes their outlook for the world over the next two and 10 years. Respondents were provided with the same five options for both time periods: (1) Calm: negligible risk of global catastrophes; (2) Stable: isolated disruptions, low risk of global catastrophes; (3) Unsettled: some instability, moderate risk of global catastrophes; (4) Turbulent: upheavals and elevated risk of global catastrophes; (5) Stormy: global catastrophic risks looming. A simple tally for each of the five options was calculated. Results are illustrated in Chapter 1, Figure 1. For 2025–2026, the risk outlook question for the world over the next two and 10 years also included five additional sub-questions, which asked respondents to indicate their outlook by risk category - geopolitical, economic, environmental, societal and technological.
Completion thresholds
A total of 1,564 responses to the GRPS were received. From these, 1,302 were used, based on the threshold of each response having at least one non-demographic answer, a minimum answer time of two minutes, and the filtering of multiple submissions based on browser cookies as well as partial responses that have overlapping IP-numbers and demographic answers with a fully recorded response.
- Current risk landscape: 1,302 respondents selected at least one risk.
- Short- and long-term risks landscape: 1,105 respondents evaluated the severity of at least one risk in one timeframe.
- Consequences: 934 respondents paired at least one risk with one consequence.
- Risk outlook: 903 respondents answered at least one question.
Global political environment for cooperation: 926 respondents answered.
Outlook for the world: 928 respondents answered over at least one timeframe, with the following number of respondents by new sub-questions.
- Societal outlook for the world: 912
- Economic outlook for the world: 903
- Environmental outlook for the world: 913
- Technological outlook for the world: 914
- Geopolitical outlook for the world: 916 - Risk governance: 738 respondents selected at least one approach for at least one risk.
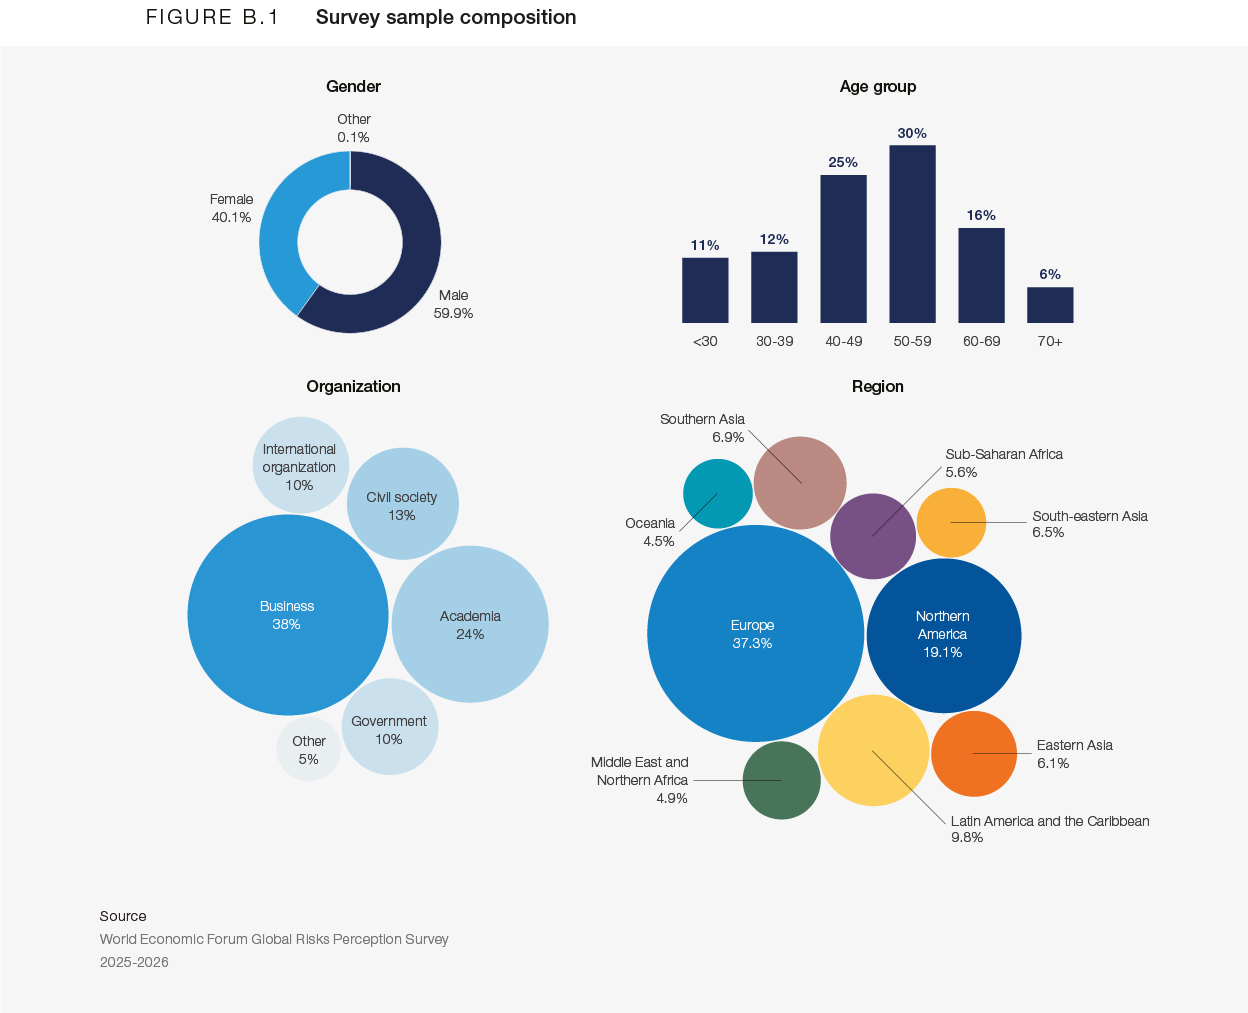
- Sample distribution: 1,302 respondents who answered at least one non-demographic question were used to calculate the sample distribution by place of residence (region), gender, age, area of expertise and organization type.
Figure B.1 presents some key descriptive statistics and information about the profiles of the respondents.