Global Gender Gap Report 2026


Trends and Pathways Shaping the Future of Parity
For two decades, the Global Gender Gap Report has benchmarked whether women and men have equal opportunities to achieve comparable outcomes across the economy, education, health and politics. While this lens remains essential, this chapter dives deeper into trends and dynamics that have the potential to bring the next step change for gender parity. The coming frontier of parity will be shaped by mechanisms generating lasting economic value and decision-making power for women: who advances into leadership, participates in high-value industries and occupations, directs capital, shapes institutions, and implements the frameworks that make room for opportunity.
Drawing on new insights from data partnerships with LinkedIn and the World Bank, this chapter of the report examines the systems that shape influence, opportunity and long-term economic resilience at this time of profound global transformation.
The first section examines the path to senior leadership and changing career pathways. The second section analyses the role that technology and the financial sector play today as engines of future economic transformation. The final section considers how decades of legal reform, institutional implementation and political representation have shaped today's opportunities and to what extent women are in positions to influence the newly emerging global order.
Corporate leadership and career pathways
Work remains fundamental to economic participation, but employment alone no longer guarantees economic stability or mobility. As labour markets evolve, the next frontier of gender parity will be shaped by access to productive, resilient and upwardly mobile careers. This section considers workforce composition, hiring trends, career breaks and talent mobility across industries and seniority levels. In collaboration with the LinkedIn Economic Graph Research Institute, the Global Gender Gap Report has tracked real-time labour-market data since its 2021 edition, providing new insights into the factors shaping gender gaps over time.
Workforce representation

Overall workforce representation
The past decade has seen an overall increase in women’s participation in the labour market. As documented in the previous section, across the 97 economies featured in every edition of the Global Gender Gap Report, the gender gap in labour-force participation narrowed from 63.7% in 2006 to 66.5% in 2026. Similarly, International Labour Organization (ILO) statistics show that women’s share in global employment increased slightly from 39.7% to 40.1% between 2006 and 2025.
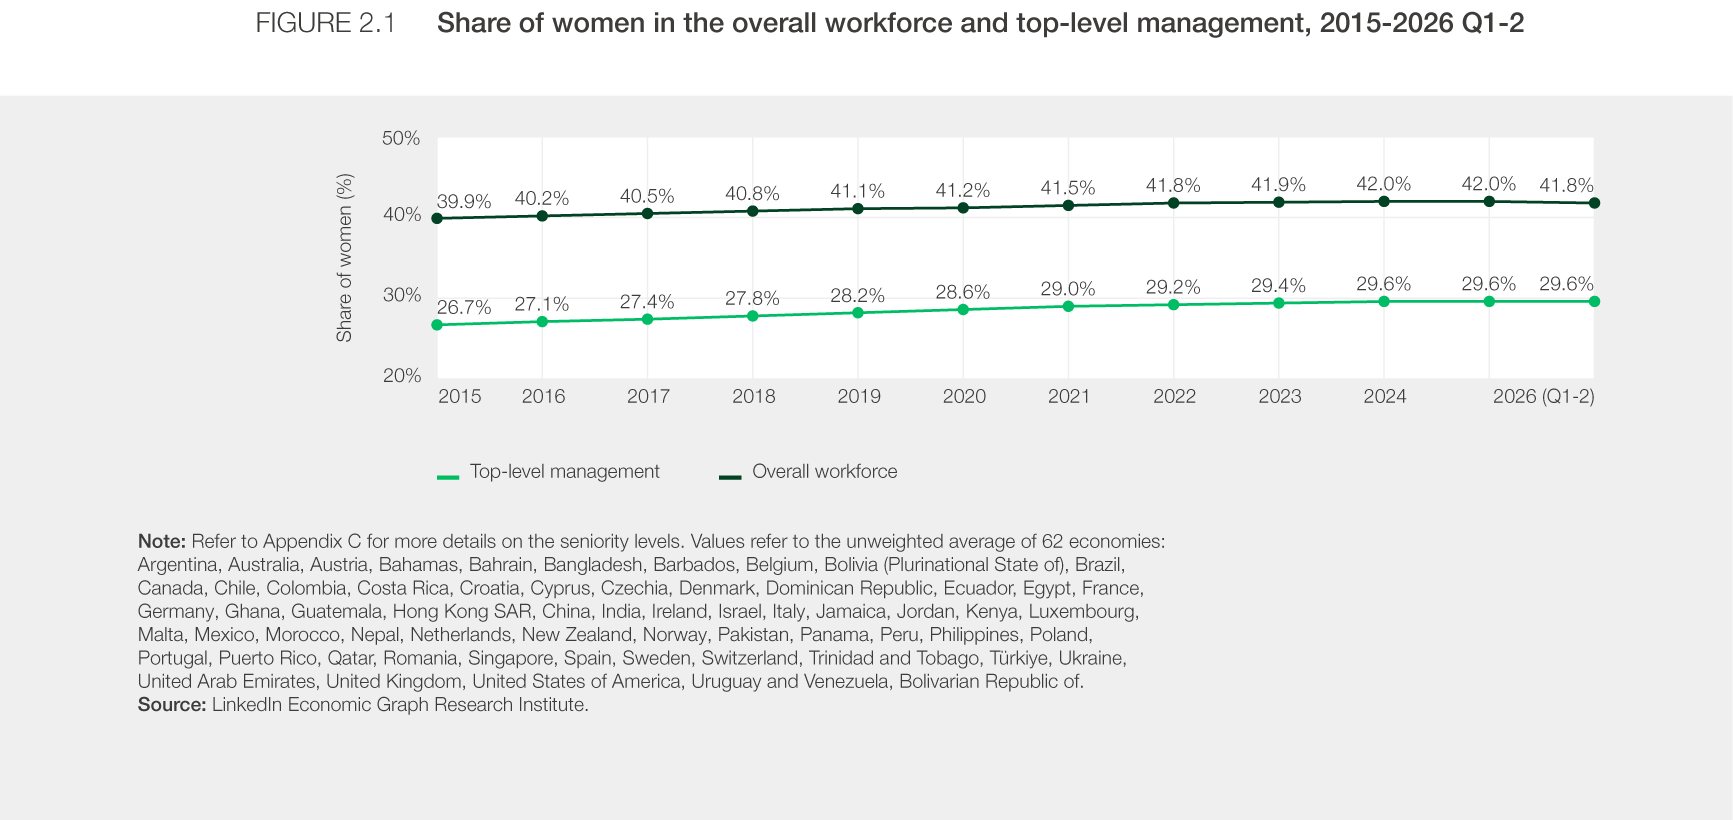
ILO statistics provide the global benchmark, while the analysis that follows draws on LinkedIn data for a more timely and granular view of labour-market dynamics. Across the 62 economies covered by the LinkedIn Economic Graph Research Institute, women’s share of the total workforce rose from 39.9% in 2015 to 42.0% in 2025. More recently, however, progress has begun to stall, with women’s representation edging down to 41.8% by June 2026 (Figure 2.1).
Representation by industry
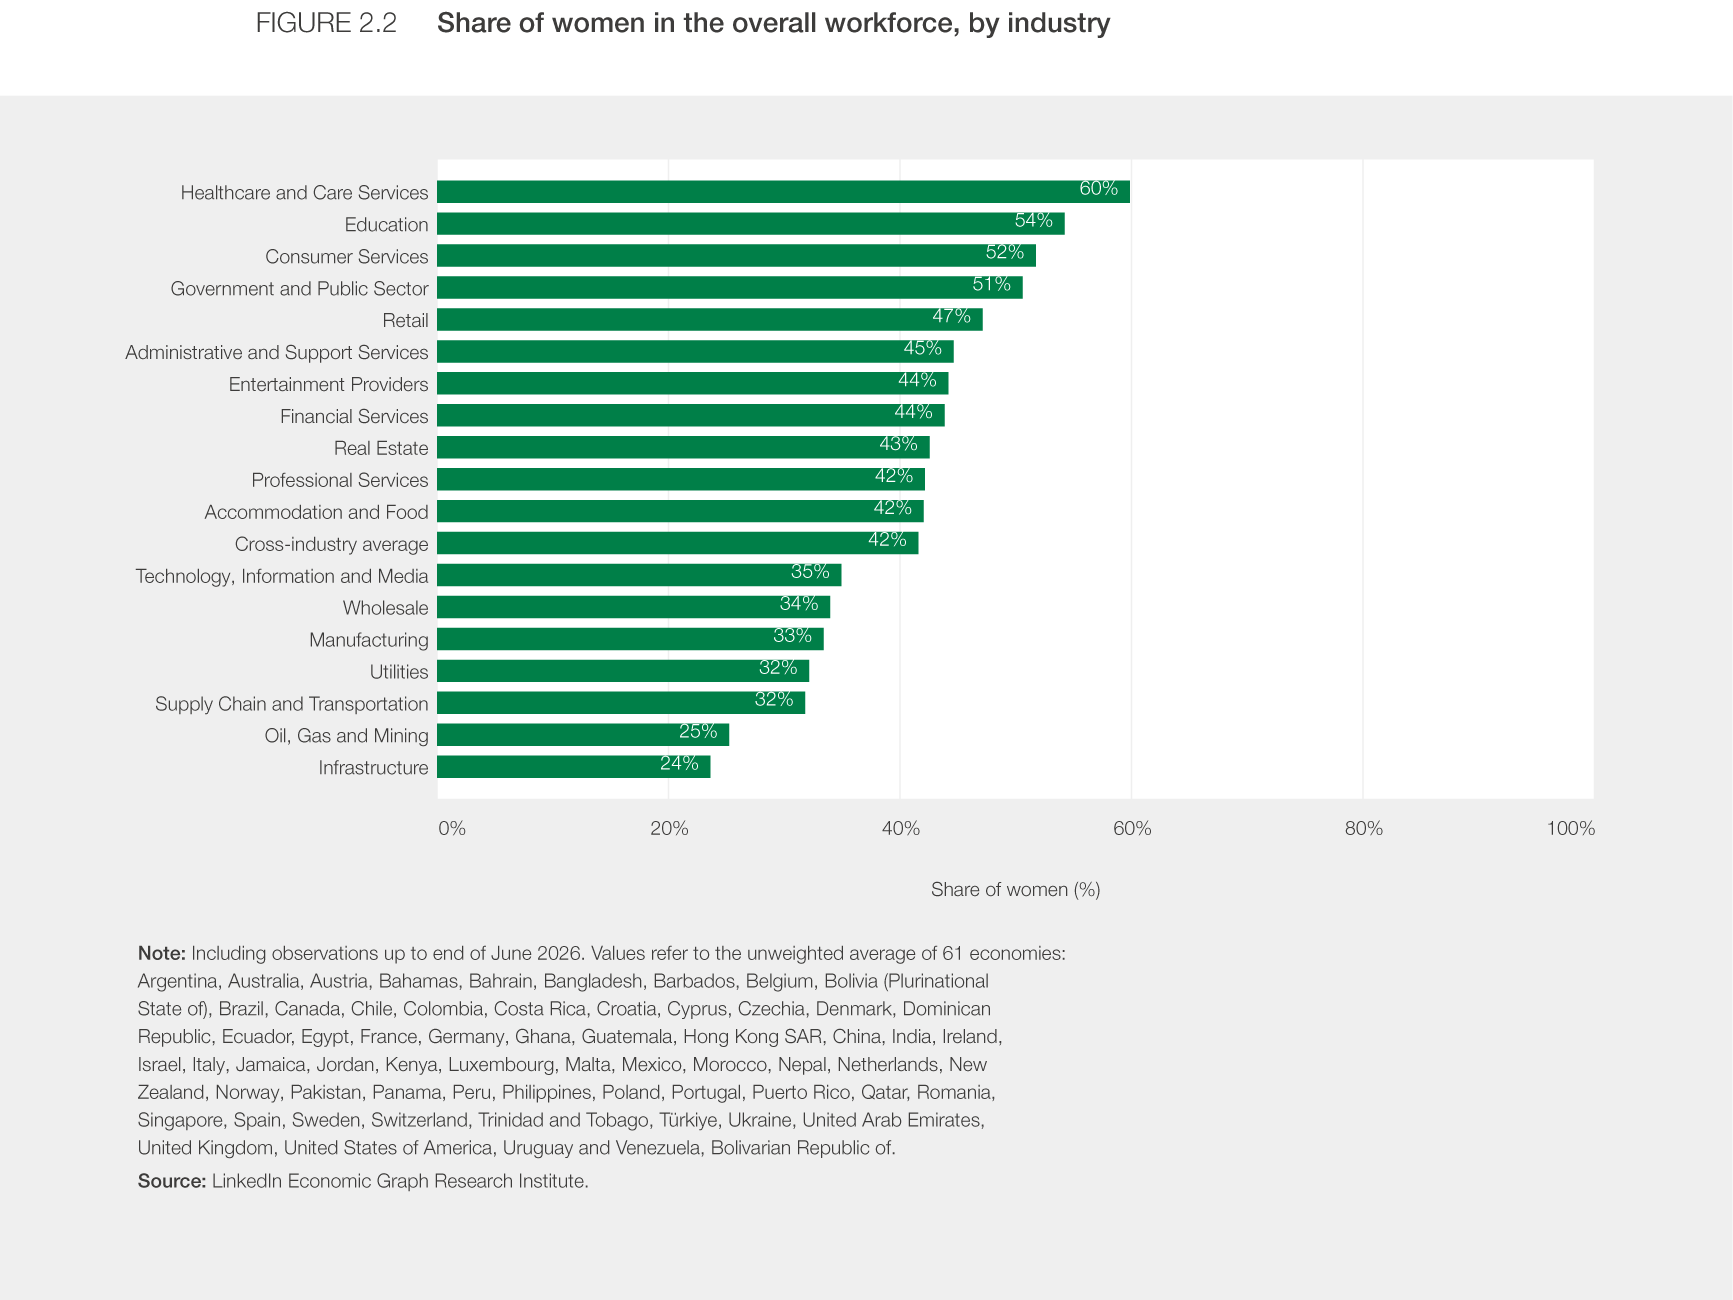
Behind this aggregate picture, women’s representation across industries remains uneven and the overall pattern has barely shifted over time. By June 2026, women accounted for more than half of the workforce in four industries: Healthcare and Care Services (59.9% vs 60.1% in 2025 and 57.8% in 2015), Education (54.2% vs 54.3% in 2025 and 52.6% in 2015), Consumer Services (51.7% vs 52.0% in 2025 and 49.6% in 2015), and Government and Public Sector (50.6% vs 50.7% in 2025 and 48.0% in 2015). At the other end of the spectrum, women make up around one-quarter of the workforce in Oil, Gas and Mining (25.2% vs 25.4% in 2025 and 24.2% in 2015) and Infrastructure (23.6% vs 23.7% in 2025 and 21.6% in 2015) (Figure 2.2).

The “Drop to the top”
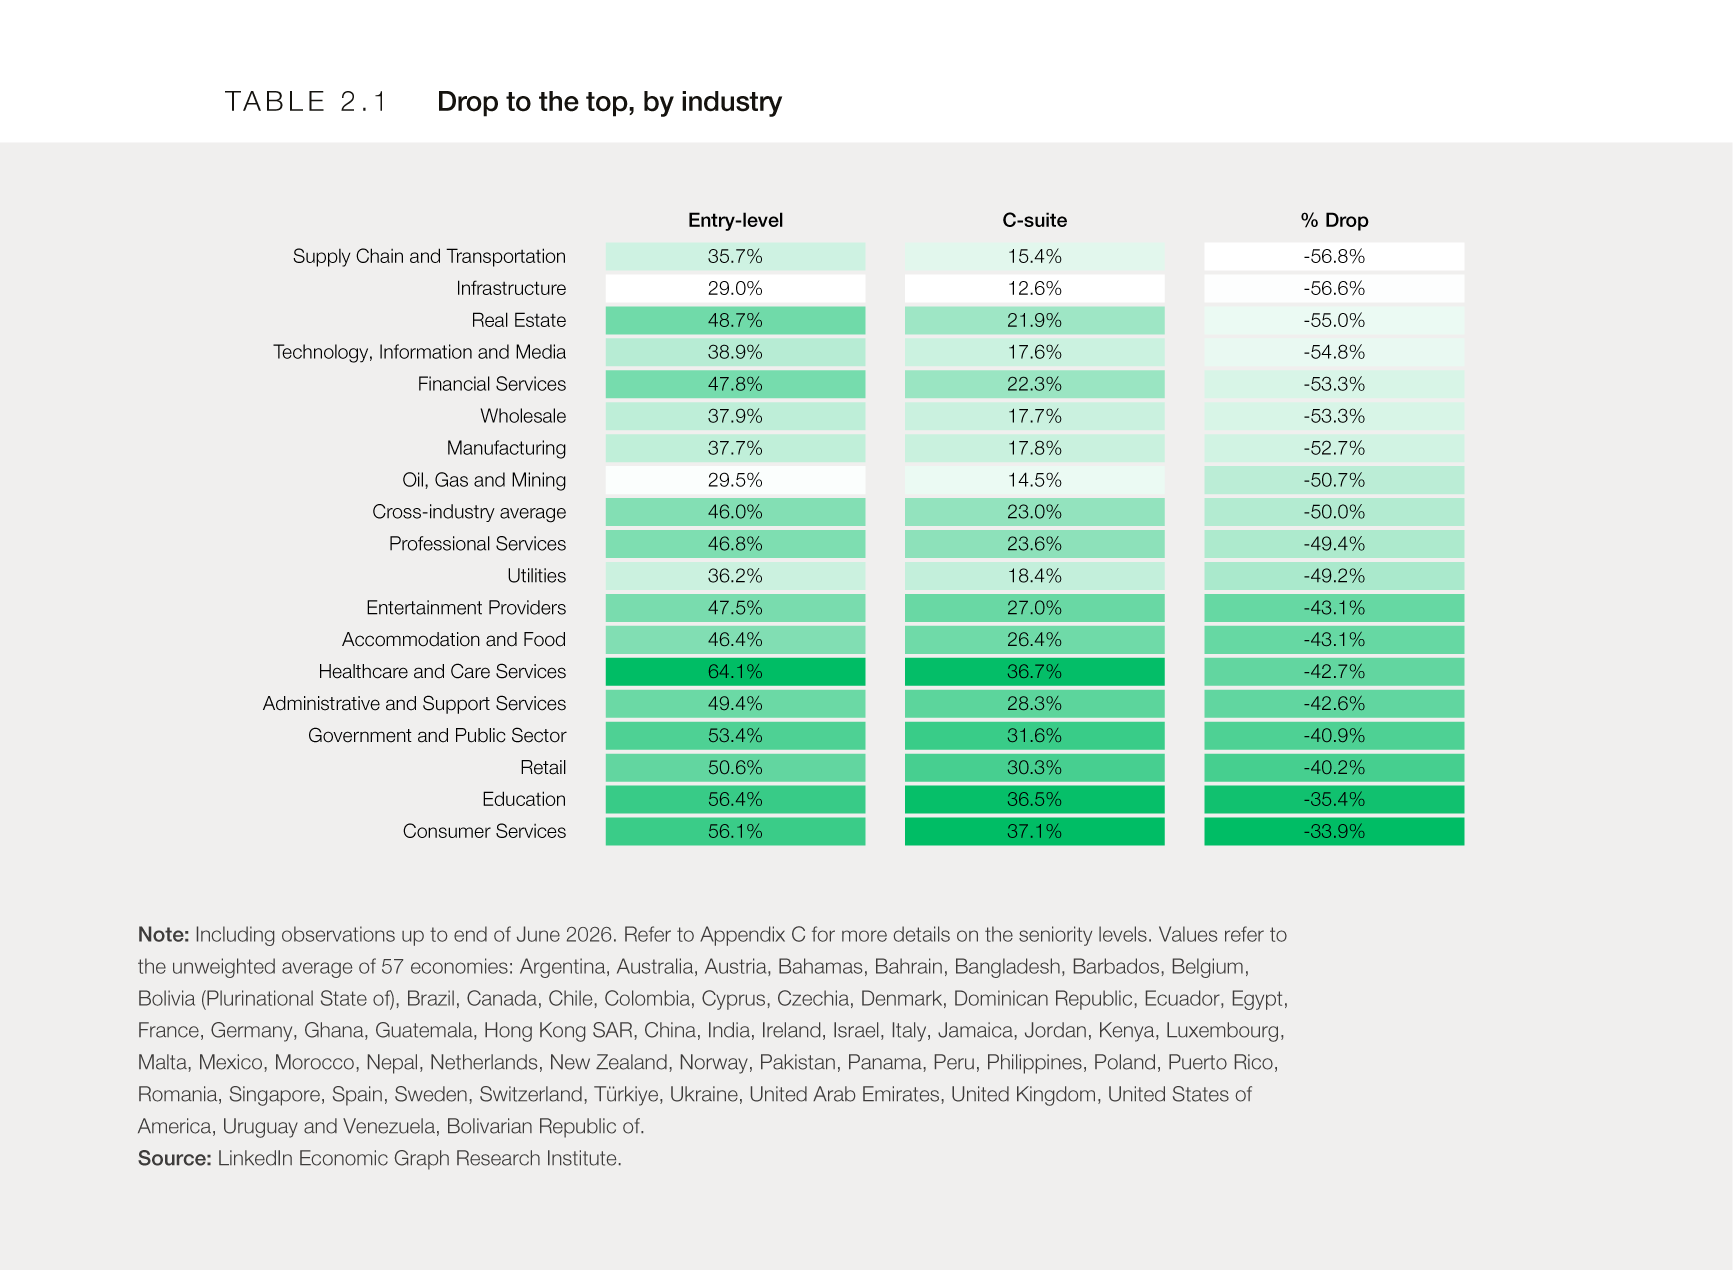
Differences in overall industry representation are compounded by how women progress through seniority levels within industries. Women’s representation decreases significantly with seniority. The gap between women’s representation in entry-level positions and the C-suite, the “drop to the top”, has been tracked across recent editions of the Global Gender Gap Report. Data from June 2026 shows that women’s representation from entry-level positions to the C-suite drops by half, from 46.0% to 23.0%, on average across 57 economies (Table 2.1).
Among the 11 economies for which LinkedIn data provide a complete trend since 2015, the average drop to the top has narrowed slightly across industries, by less than 10 percentage points. This narrowing has been driven primarily by faster gains in women’s representation at the C-suite level than at entry level. Sustaining progress toward parity will therefore require building on gains in senior leadership while accelerating women’s representation at the entry point to strengthen the leadership pipeline over time.
The degree of the drop to the top varies considerably across industries: from around one-third in Consumer Services (33.9%) and Education (35.4%) to more than half in Supply Chain and Transportation (56.8%), Infrastructure (56.6%) and Real Estate (55.0%). Overall, industries with a higher share of women at entry level tend to have a relatively smaller drop to the top, but this relationship does not hold consistently. For example, in Real Estate and Financial Services, women account for around 48% of entry-level positions, above the cross-industry average, yet the drop to the top reaches 53–55%, also above the cross-industry average. By contrast, in Utilities, women hold 36.2% of entry-level positions, almost 10 percentage points below the average of 46%, while the drop to the top, at 49.2%, is roughly in line with the cross-industry average (Table 2.1).

The stage at which women experience the sharpest decline across the seniority hierarchy also differs by industry. For example, in Oil, Gas and Mining, women’s representation drops early in the career pipeline, by one-third between individual contributors and mid-level management, and a further 10% between mid- and top-level management. While in Financial Services and Technology, Information and Media, women’s representation declines relatively modestly (at around 15%) from individual contributors to mid-level management roles but drops by almost 25% at the transition to top-level management. Building more inclusive talent pipelines therefore requires both industry-specific and career-stage-specific approaches.
Senior leadership representation trends
While the drop to the top remains significant, overall, the past decade has been marked by progress in women’s representation in senior leadership. Women’s representation in top-level management roles, comprising vice presidents, C-suite and board members, increased from 26.7% in 2015 to 29.4% by 2023, but has remained at approximately this level since then (Figure 2.1).
C-suite representation
Within the C-suite, the following patterns emerge on average for the 39 economies included in the sample: Among the most common roles, women account for 19.1% of chief executive officers (CEO) and around one-quarter of chief financial officers (CFO) and chief operating officers (COO), positions that typically carry the greatest decision-making power. This uneven representation also has implications for pathways to the top: prior CEO, CFO and COO experience is among the most common backgrounds of CEOs at the world’s largest publicly traded companies. Yet representation in these feeder roles alone does not close the gap. Even among executives with comparable CEO-feeder experience, women are currently less likely than men to become CEOs. This suggests that barriers persist beyond entry into the leadership pipeline, including in the processes and selection decisions that determine who ultimately reaches the top. (Figure 2.3).
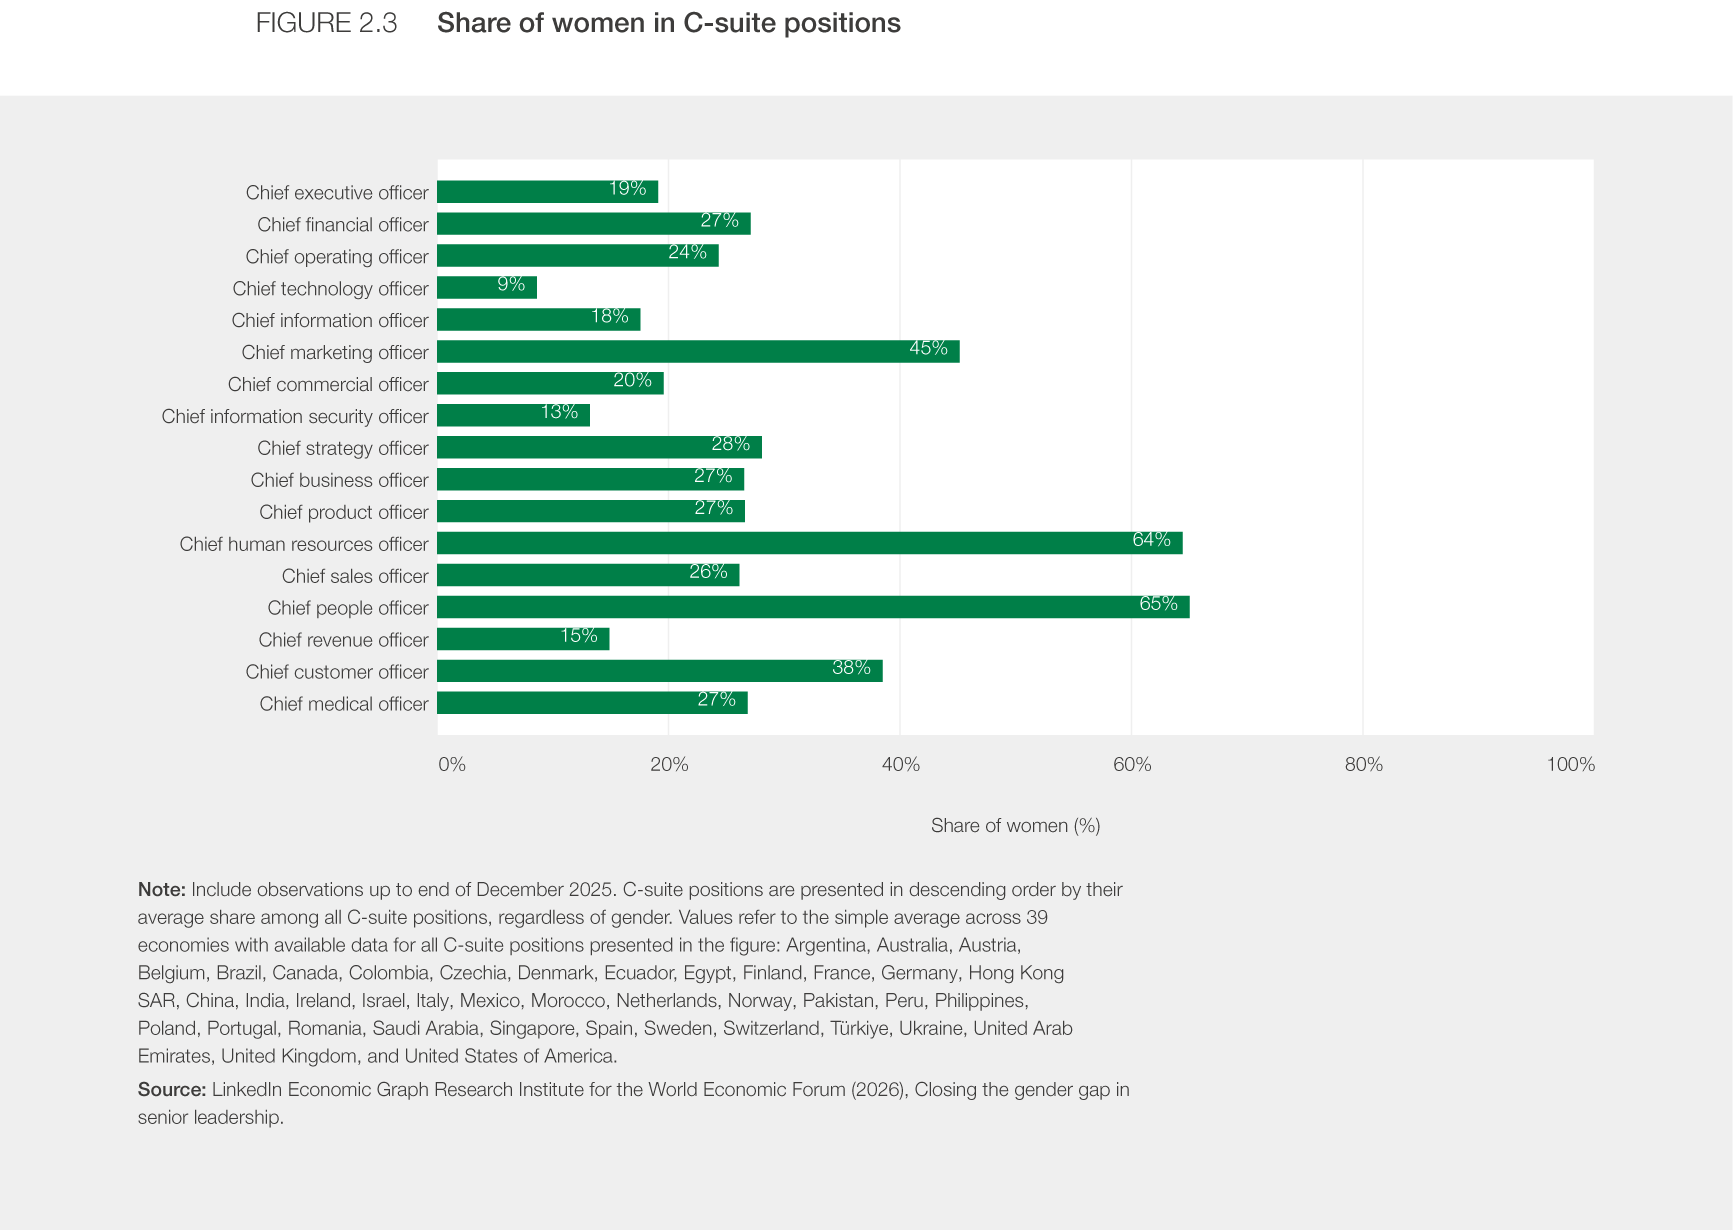

Women are more strongly represented in some functionally oriented C-suite roles, accounting for around two-thirds of chief human resources officers (CHRO) and chief people officers (CPO) in the LinkedIn sample and slightly less than half of chief marketing officers (CMO). By contrast, they remain underrepresented in technology-oriented leadership roles that have gained prominence as digital transformation and AI reshape corporate leadership structures. Women represent less than one in five chief information officers (CIO) and just 8.6% of chief technology officers (CTO) (Figure 2.4). As C-suite structures evolve, these differences matter not only for current representation, but also for women’s access to the functions and experiences that can provide pathways to the most senior leadership positions.
Board representation
Uneven representation at the highest levels of decision-making extends to corporate boards. Between 2014 and 2024, the share of board seats held by women nearly doubled, from 15.2% to 29.3%. Yet progress in overall board representation has not translated into equivalent gains in board leadership positions, where women’s representation increased from 3.2% to 5.2% over the same period and remains marginal.
CEO representation
A review of the Fortune Global 500 offers an additional perspective on women’s presence at the helm of the world’s largest companies by revenue. Over the past decade, the number of women CEOs in the Fortune Global 500 increased from 14 in 2015 to 32 in 2025, corresponding to a rise in their share from 2.8% to 6.4% (Figure 2.4).
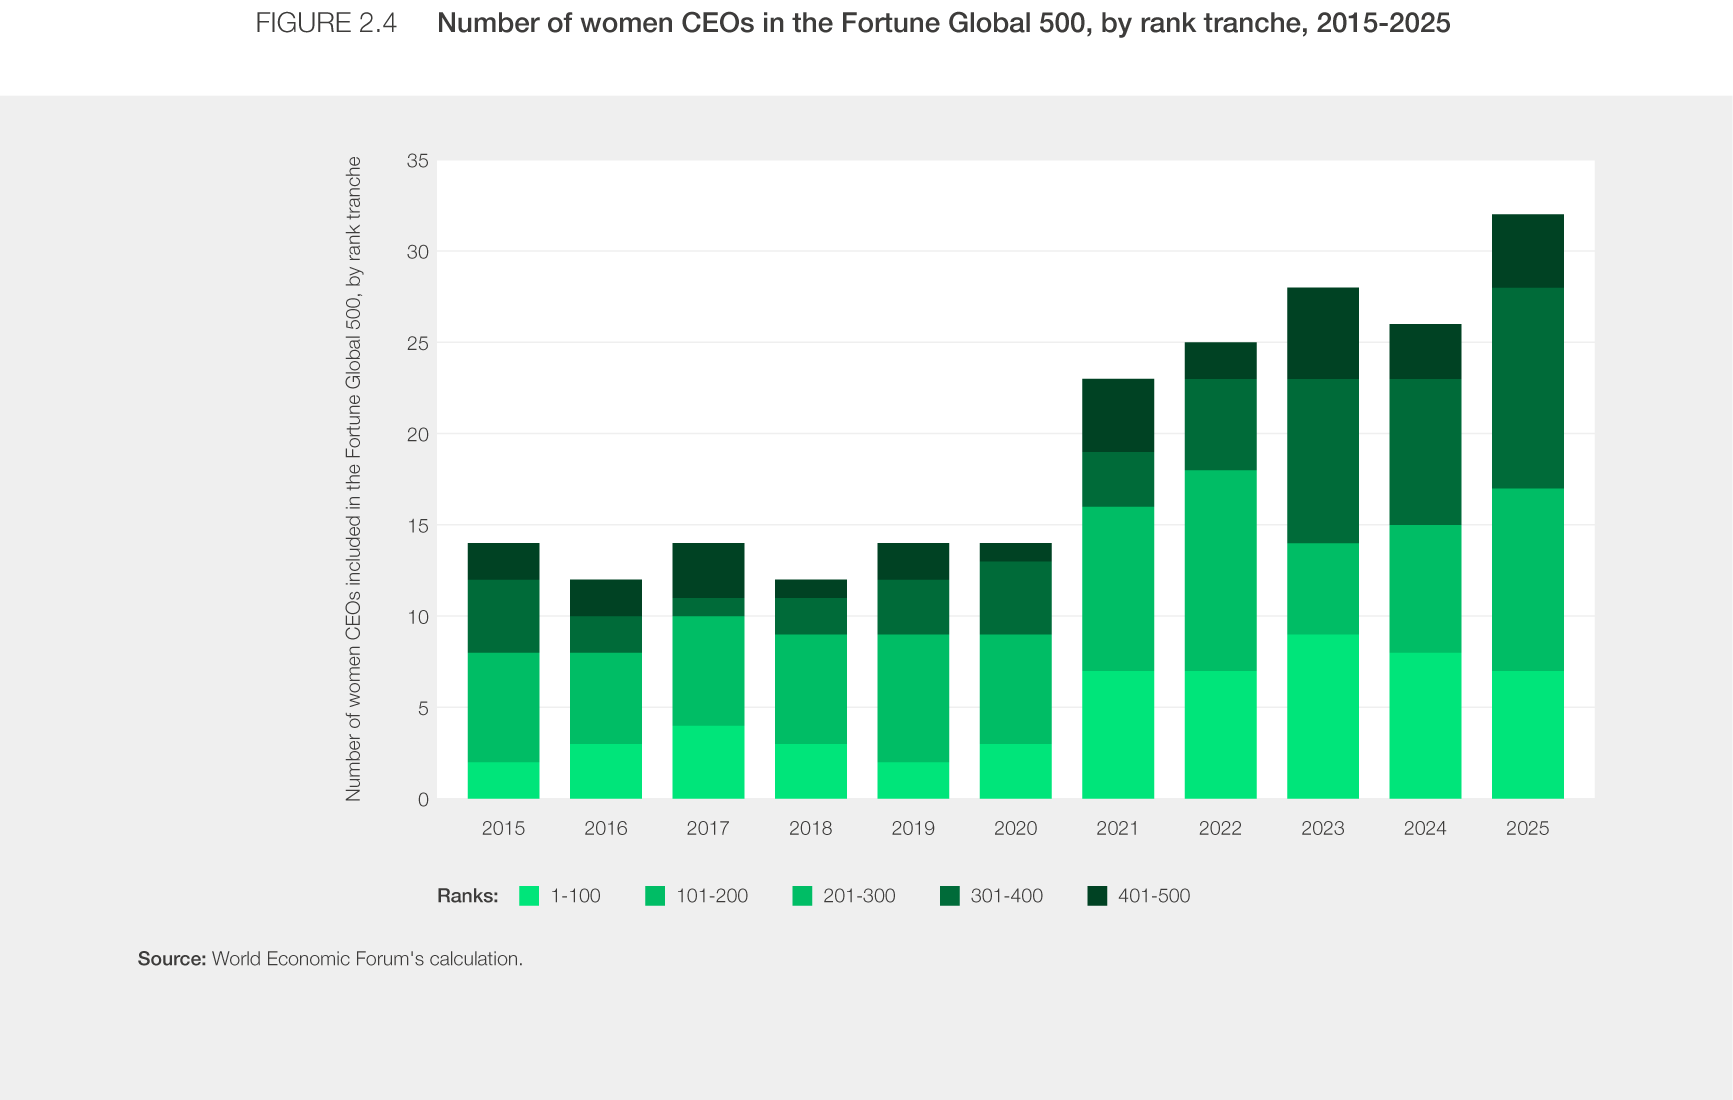

The 2025 Fortune Global 500 has a varied industry makeup. Financial services and insurance companies represent 26% of the list, with 131 firms included. Industrial manufacturing and materials, as well as energy, oil and gas, each account for more than 10% of listed companies. Sectors with more companies in the ranking tend to have more women CEOs overall. However, when measured as a share of each sector, female representation varies in meaningful ways. In 2025, Utilities recorded the highest proportion of women CEOs in 2025, at 17%, followed by telecommunications and media at 11%. Retail and consumer distribution, energy, oil and gas, and construction and real estate each recorded shares of around 9%.
The representation of women CEOs also varies across company revenue rankings and over time. Among the 100 largest companies by revenue in the Fortune Global 500, the number of women CEOs remained at around 3 between 2015 and 2020, before increasing to 7 in 2021 and 2022. It reached a peak of 9 in 2023 and subsequently declined to seven in 2025. As a share of all women CEOs in the Fortune Global 500, those leading companies in the top 100 accounted for slightly more than 30% between 2021 and 2024, before declining to around 22% in 2025 (Figure 2.4). This pattern is broadly consistent with the earlier observations from LinkedIn data, suggesting that recent progress toward greater gender parity in corporate leadership has lost some momentum.
Hiring trends
Hiring data provides an important window into the likely future evolution of senior leadership patterns. Over the past decade, the share of women among overall hires increased through the first years of the COVID-19 pandemic, from 42.7% in 2016 to 45.8% in 2022, before declining to 44.4% by June 2026 (Figure 2.5).
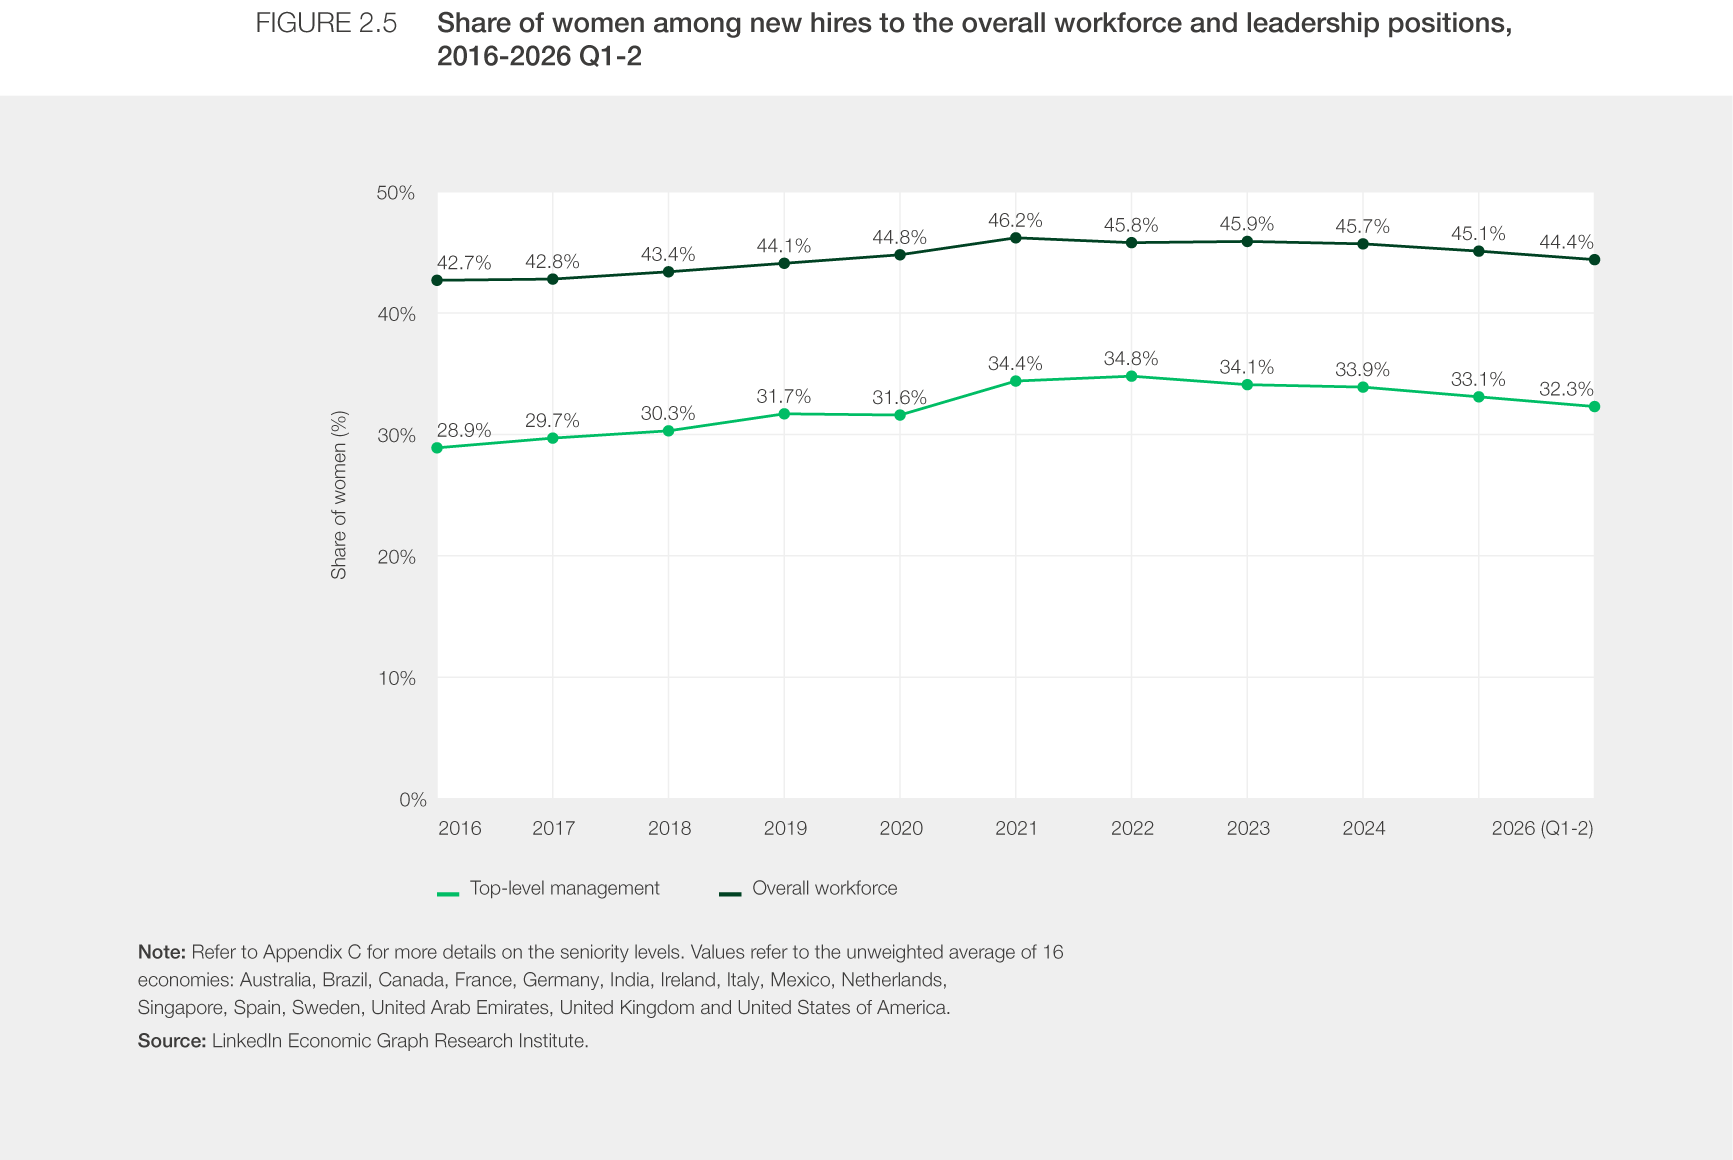

While the direction of these trends is similar, hiring into top-level management has been more volatile than hiring into the overall workforce. Between 2016 and 2022, the relative increase in women’s share of hires was considerably larger for top-level management than for the overall workforce (20.3% compared with 7.4%). Since 2022, the decline has also been steeper for top-level management (7.2% compared with 3.1%). These recent hiring trends are consistent with the broader slowdown in women’s representation documented above, including the stalling of progress at senior levels (Figures 2.1 and 2.3); and 2026 has so far seen another decline in the series of consecutive drops since 2022.
Career pathways
As documented in the 2025 Global Gender Gap Report, modern careers are becoming increasingly non-linear. This section considers whether men’s and women’s careers remain equally resilient in the face of different types of career breaks and less linear pathways.
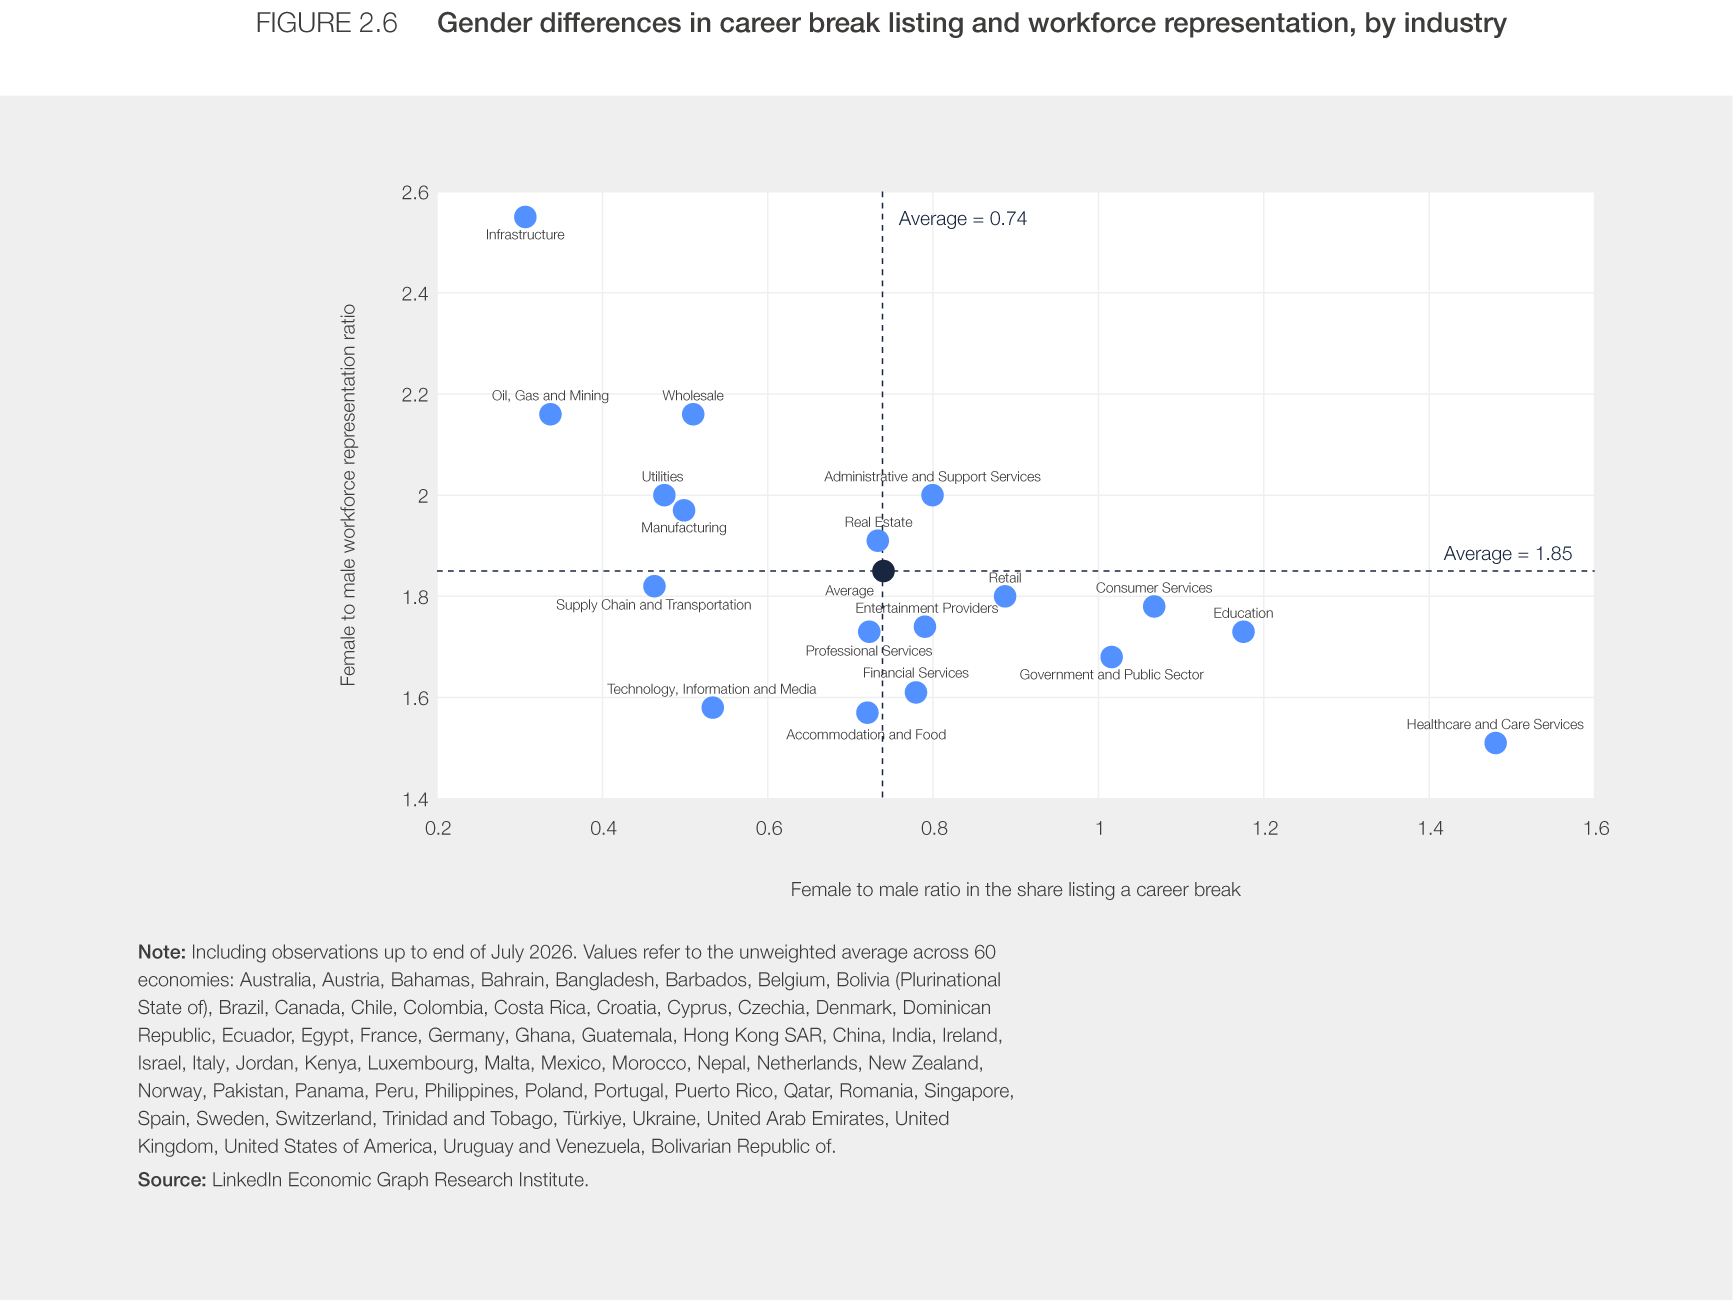
Women are almost twice as likely as men to list career breaks, according to LinkedIn data covering 60 economies. Across industries, a negative association emerges between the gender gap in reported career breaks and women’s current workforce representation: industries with relatively high female representation tend to show smaller female-to-male differences in career-break reporting. Healthcare and Care Services, for example, has the highest female-to-male workforce representation ratio (1.5) and one of the lowest career-break ratios (1.5), with Education and Government and Public Sector showing a similar pattern. By contrast, Infrastructure and Oil, Gas and Mining combine some of the lowest female-to-male representation ratios (0.3 and 0.3, respectively) with among the largest career-break ratios (2.6 and 2.2). The relationship is not uniform across all industries: Technology, Information and Media has relatively low female representation ratio (0.5) despite a comparatively small career break ratio (1.6), while Administrative and Support Services is the only industry with both an above-average female-to-male career-break ratio (2.0) and above-average female-to-male workforce representation (0.8) (Figure 2.6).

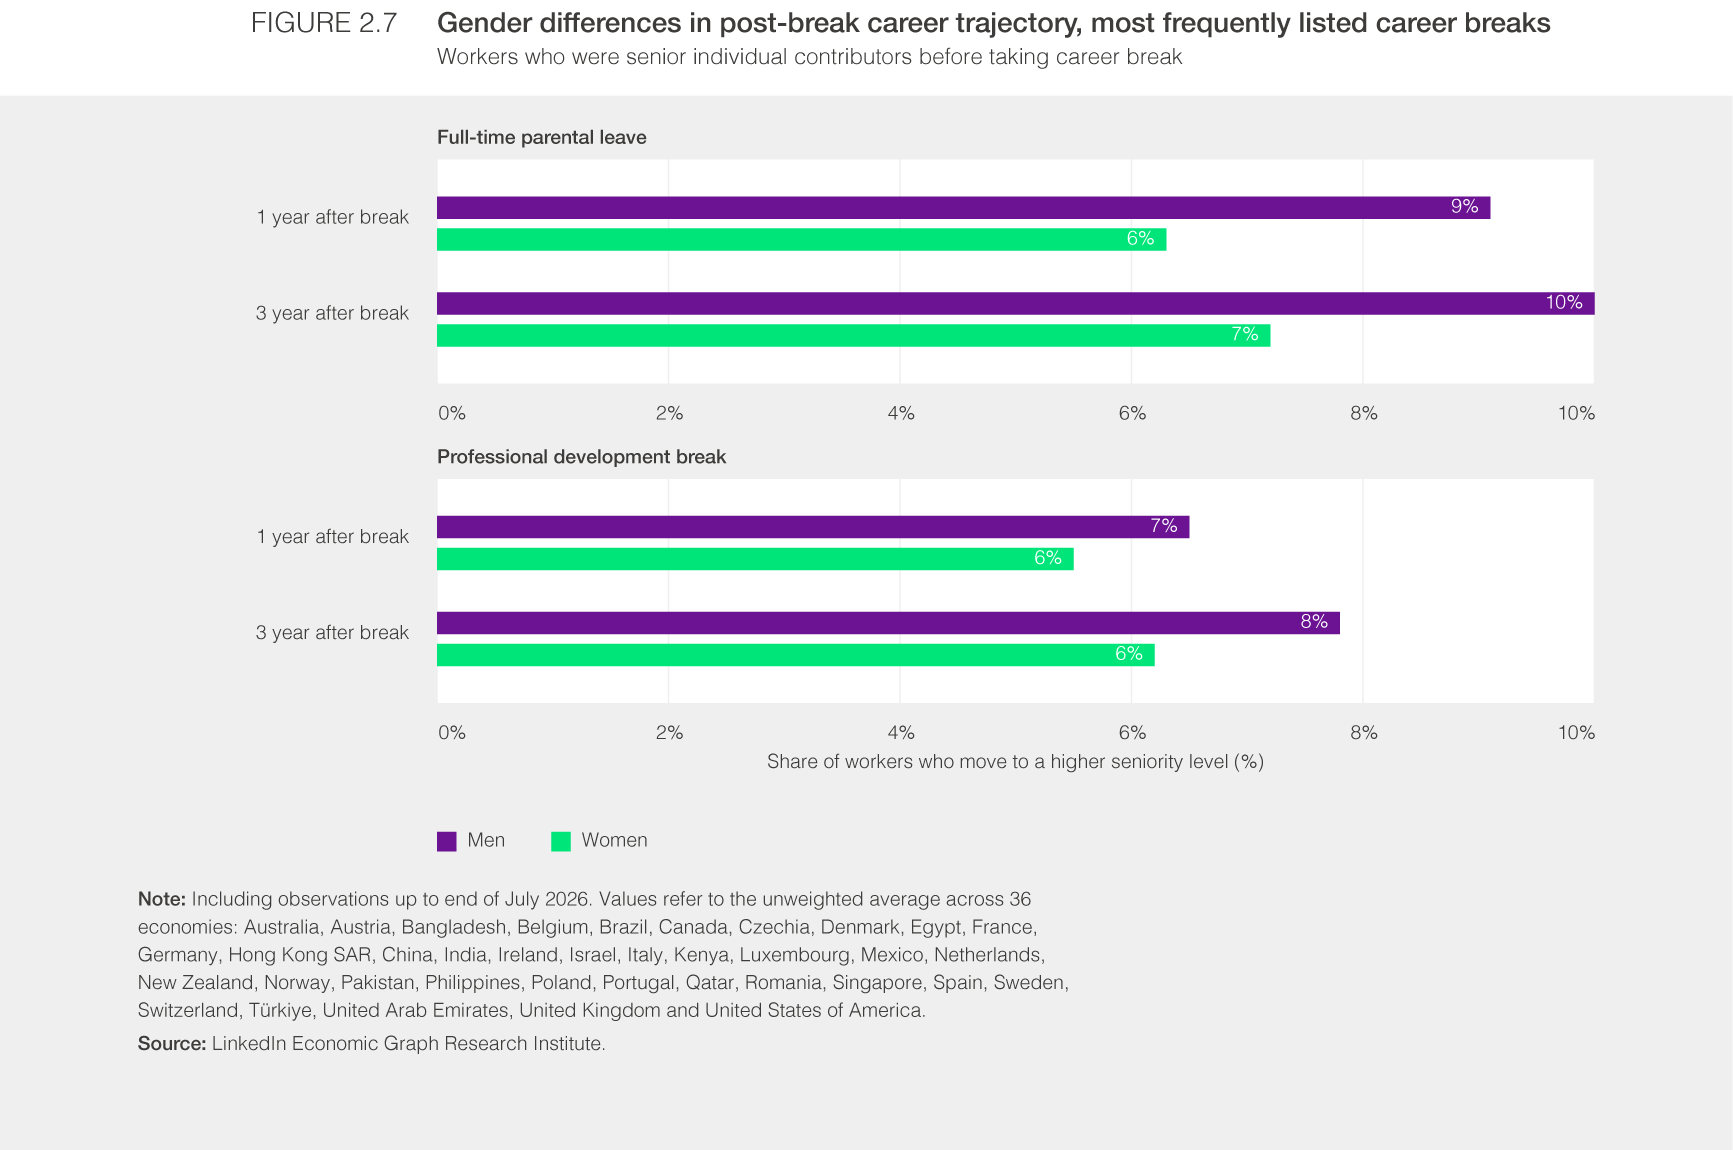
Full-time parental leave is the most common reason women take a career break: women are more than four times as likely as men to take a break for full-time parenting, at 26.5% compared with 6.0%. By contrast, professional development is the most common reason for men to take a career break and the second most common reason for women, cited by 19.8% of men and 15.1% of women. Together, these two categories capture the most common types of career breaks taken by women and men, making them particularly relevant for examining post-break career progression.
Among workers taking these career breaks, senior individual contributors provide the most consistent comparison across the economies covered by LinkedIn. Within this group, the share of workers who move to a higher seniority level increases between one and three years after returning from both types of breaks and remains consistently higher for men. One year after returning from a full-time parenting break, 6.3% of women had moved to a higher seniority level, compared with 9.1% of men; three years after return, the shares were 7.2% and 10.0%, respectively. The finding is salient when comparing data from professional-development breaks, where the gap is smaller but slightly widens over time: 5.5% of women and 6.5% of men had increased their seniority level after one year, compared with 6.2% and 7.8% after three years (Figure 2.7).

Taken together, the data suggests that real progress in women’s workforce representation and leadership is creating a stronger foundation for broader industry transformation. Gains in senior leadership representation demonstrate the potential for continued advancement, while differences across and within industries point to where further progress can have the greatest impact. These patterns also intersect with persistent differences across industries and gendered patterns in career breaks and post-return progression, highlighting how workforce mobility and gender parity remain interlinked.
Technology and capital
Alongside developments in the labour market, innovation, technology and investment are reshaping the architecture of economic opportunity. How these systems concentrate value or distribute it determines who participates, advances and benefits from economic transformation, and with it the state of gender parity.
Representation trends in the AI ecosystem
As economies become increasingly AI-intensive, the implications for gender parity extend across the labour market. The World Economic Forum white paper Gender Parity in the Intelligent Age found that women are more concentrated than men in jobs exposed to AI-driven disruption and less represented in roles where AI is expected to augment workers’ capabilities. These patterns are not fixed and will continue to evolve as AI adoption, job design and workforce skills change.
This section focuses on a related dimension: women’s participation within the AI ecosystem itself. As AI becomes part of the core infrastructure of a new economic model, gender parity is shaped not only by who is affected by the technology, but also by who participates in developing and deploying it. Women’s representation in AI firms, across functions and seniority, provides an indication whether patterns of occupational and sectoral segregation are being reproduced in this emerging industry, which can cap the visibility, remuneration and influence women can have.

Representation between AI and non-AI firms
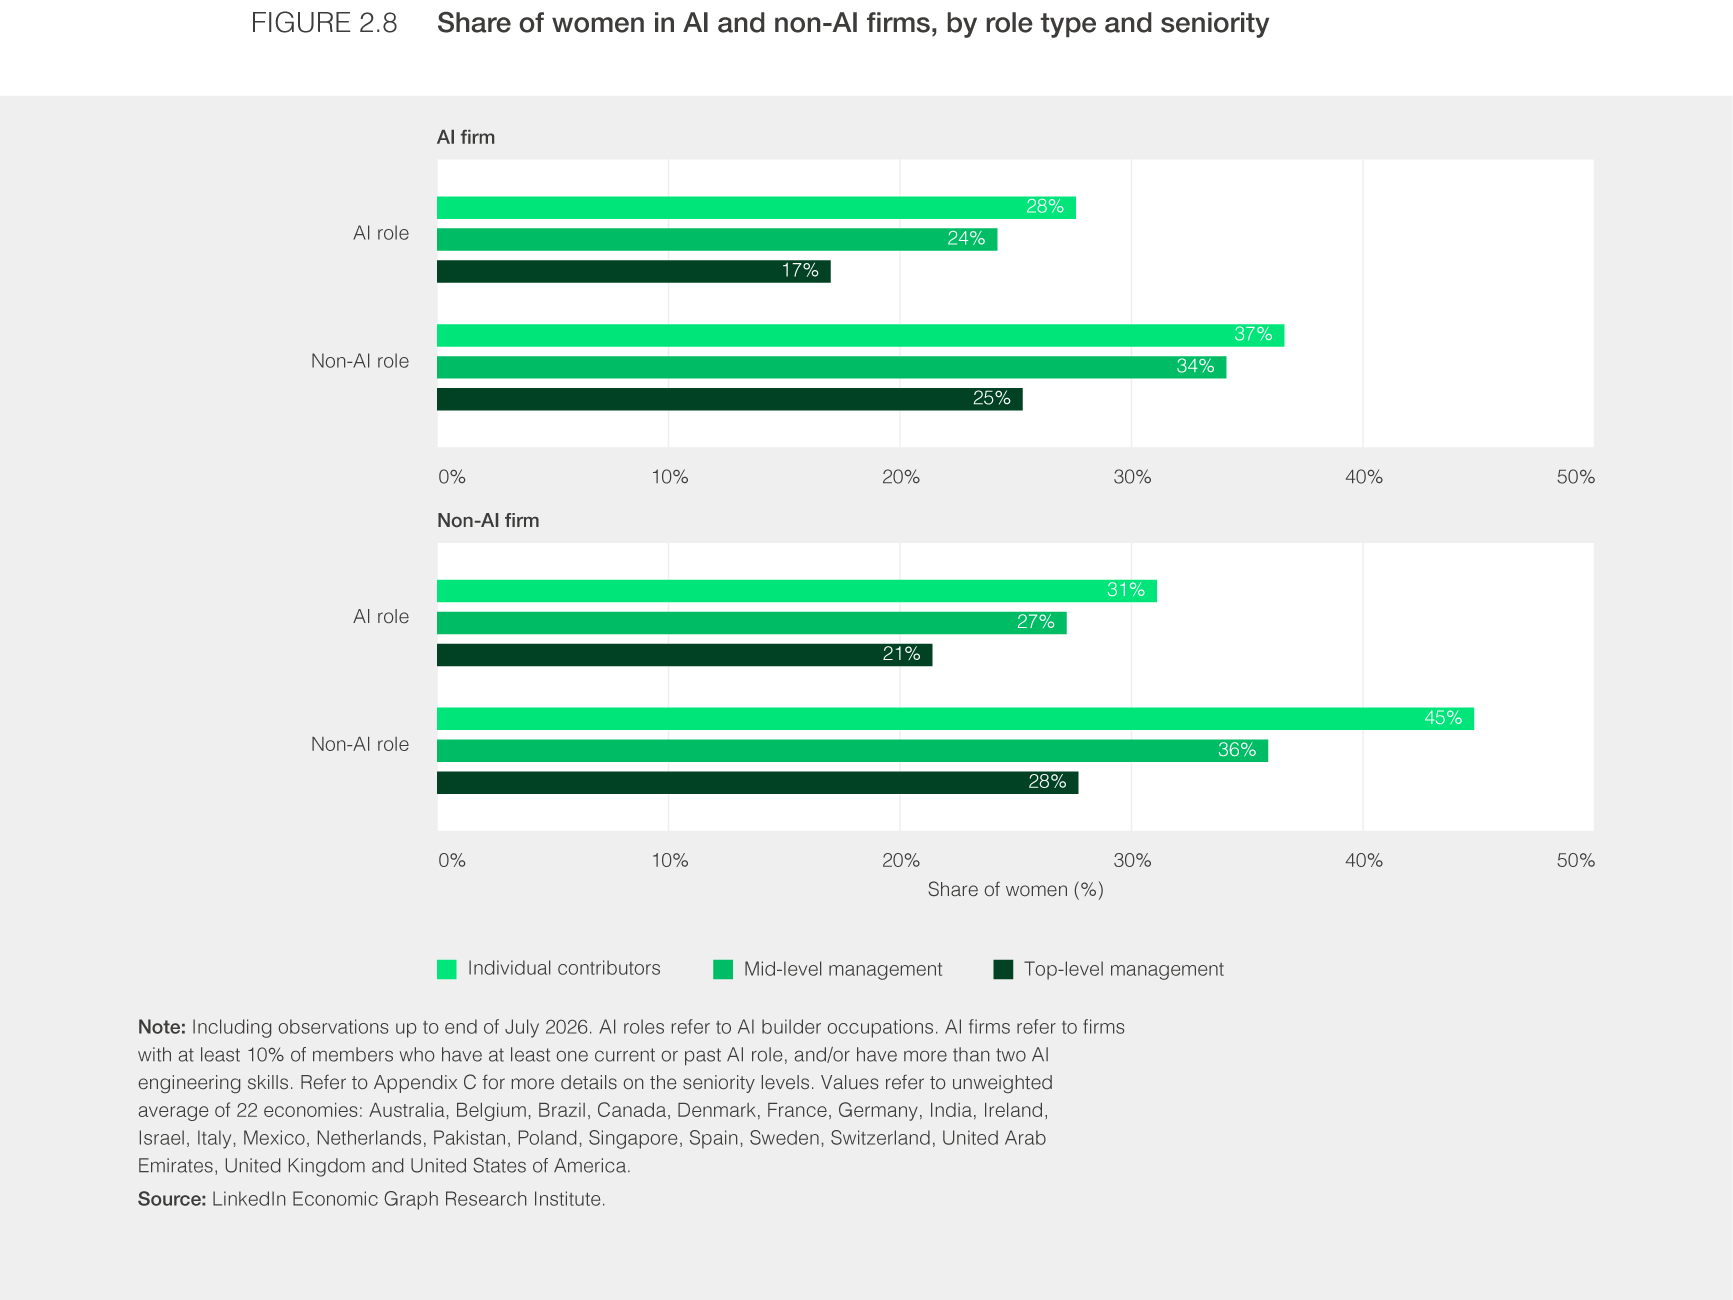
As broadly observed across the labour market, women’s representation declines with seniority, and this pattern holds in both AI – defined as those with at least 10% concentration of AI talent and skills – and non-AI firms. However, women are consistently less represented in AI firms than in non-AI firms at comparable seniority levels: they account for 36.6% versus 44.8% of individual contributors, 34.1% versus 35.9% of professionals in mid-level management positions, and 25.3% versus 27.7% of professionals in top-level management positions. The gap is also evident in AI vs non-AI roles, with women less represented in AI roles than in non-AI roles across both firm types and at every seniority level (Figure 2.8).
Representation by AI firm type
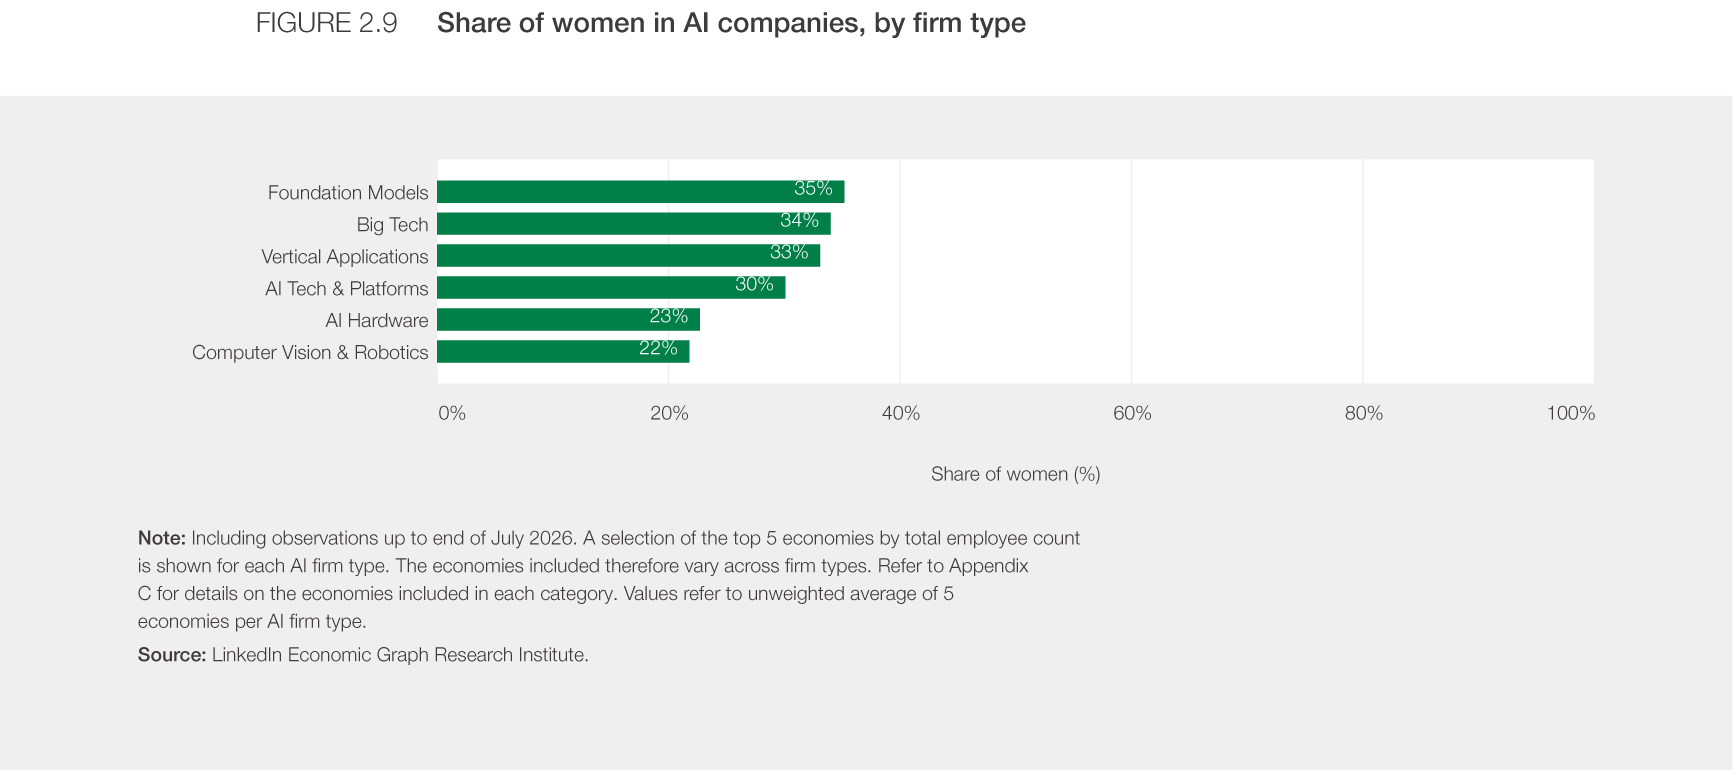
These differences also extend across segments of the AI ecosystem, with activity concentrated differently across economies and firm types. As a result, not all economies covered by the LinkedIn dataset have sufficient observations for every AI firm type. To provide a comparable view, the analysis focuses on the top five economies with the largest employee samples for each firm type.
Across these economies, women’s representation is lowest in the more hardware- and physical-world-intensive segments of the AI ecosystem, at 21.8% in computer vision and robotics firms and 22.7% in AI hardware firms. Representation is higher in firms focused on AI development and deployment: women account for 30.1% of employees in AI tech and platform firms and 33.1% in vertical application firms. Their representation is slightly higher still in Big Tech firms involved in the AI supply chain or deploying AI in their products, at 34.0%, and in foundation model firms developing large-scale models, at 35.2% (Figure 2.9). These estimates do not include China, an important limitation given the country’s significant role in the global AI ecosystem.

Representation by AI role type
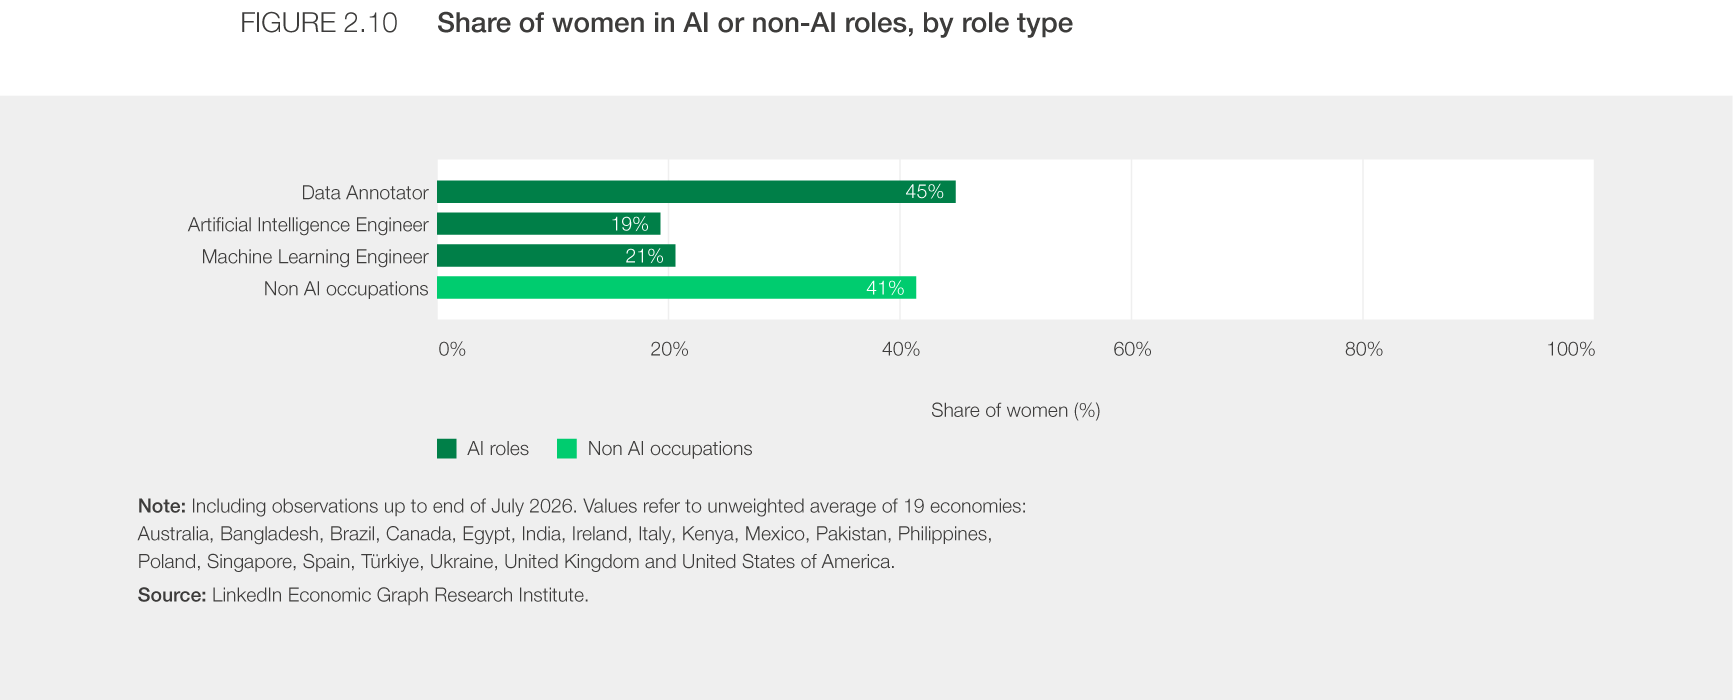
The differences in women’s representation across AI firm types suggest that their participation is unevenly distributed across the AI value chain. This pattern becomes even more pronounced when looking at specific AI occupations. LinkedIn data show that women are comparatively well represented in data annotator roles, which support the preparation and labelling of data used to train AI systems. Across the 19 economies with available data, women account on average for 44.8% of data annotator roles, above their 41.4% share in non-AI roles. By contrast, their representation falls by more than half in occupations more closely associated with model development and deployment, to 19.3% among AI engineers and 20.6% among machine learning engineers (Figure 2.10). These estimates do not include China, an important limitation given the country’s significant role in the global AI ecosystem.
The occupations shown in Figure 2.10 are a selected set with sufficient presence across economies to support cross-country comparison. LinkedIn’s analysis of the United States adds an important pay dimension to this picture. Notably, data annotators, the AI role in which women are most represented, are also among the lowest-paid AI roles in the United States, with midpoint job posting pay below that of the median of non-AI occupations. At the other end of the spectrum, women are less represented in many of the highest-paid AI roles. This pattern also shows why seniority alone does not fully capture where economic value is concentrated within the AI workforce: highly technical roles such as member of technical staff can command higher pay than some senior management positions, including VP of AI and head of AI. Examining specific occupations alongside seniority therefore provides a more complete picture of how women are distributed across the AI workforce.

As AI becomes more deeply embedded across the economy, new roles may emerge at the intersection of technical expertise and industry know-how. This shift could broaden the range of talent relevant to AI development and deployment. Recognizing and advancing women’s expertise across these functions may help companies broaden their talent base and support the development of competitive AI-enabled products and services.
Representation trends in the financial ecosystem
Equal access to the systems that capture, accumulate and allocate economic value is as central to gender parity as women’s participation in value-generating industries. Data from the financial sector helps outline how women and men engage with the systems underpinning resilience, financial influence and economic power. It also illustrates the roles that ownership, investment and financial decision-making play in determining who can build and preserve wealth, exercise economic agency and shape the economic future.
At the most basic level, financial account ownership, a key measure of financial inclusion, has increased globally over time. Across the 96 economies covered in the Global Gender Gap Report 2026 with comparable trend data from the World Bank Global Findex database, the average share of adults with a financial account rose for both women and men, with a slightly larger increase among women. Account ownership among men increased from 57.5% in 2011 to 79.5% in 2025, while among women it rose from 52.1% to 73.6%.
While access to financial services has expanded, the next level of gender parity in economic value creation depends on who participates in and shapes the institutions that allocate capital, design financial products and make investment decisions. LinkedIn data provides further insight into women’s representation across financial-services subsectors, distinguished by their functions within the financial system.
Across the 19 economies with available data, women’s representation is highest in insurance (48.3%), followed by credit intermediation (43.5%) and capital-market activities (40.4%). This pattern broadly runs counter to the relative influence of these segments within the financial ecosystem, with capital-market institutions accounting for a smaller share of employment but playing an important role in directing investment and allocating capital (Figure 2.11).
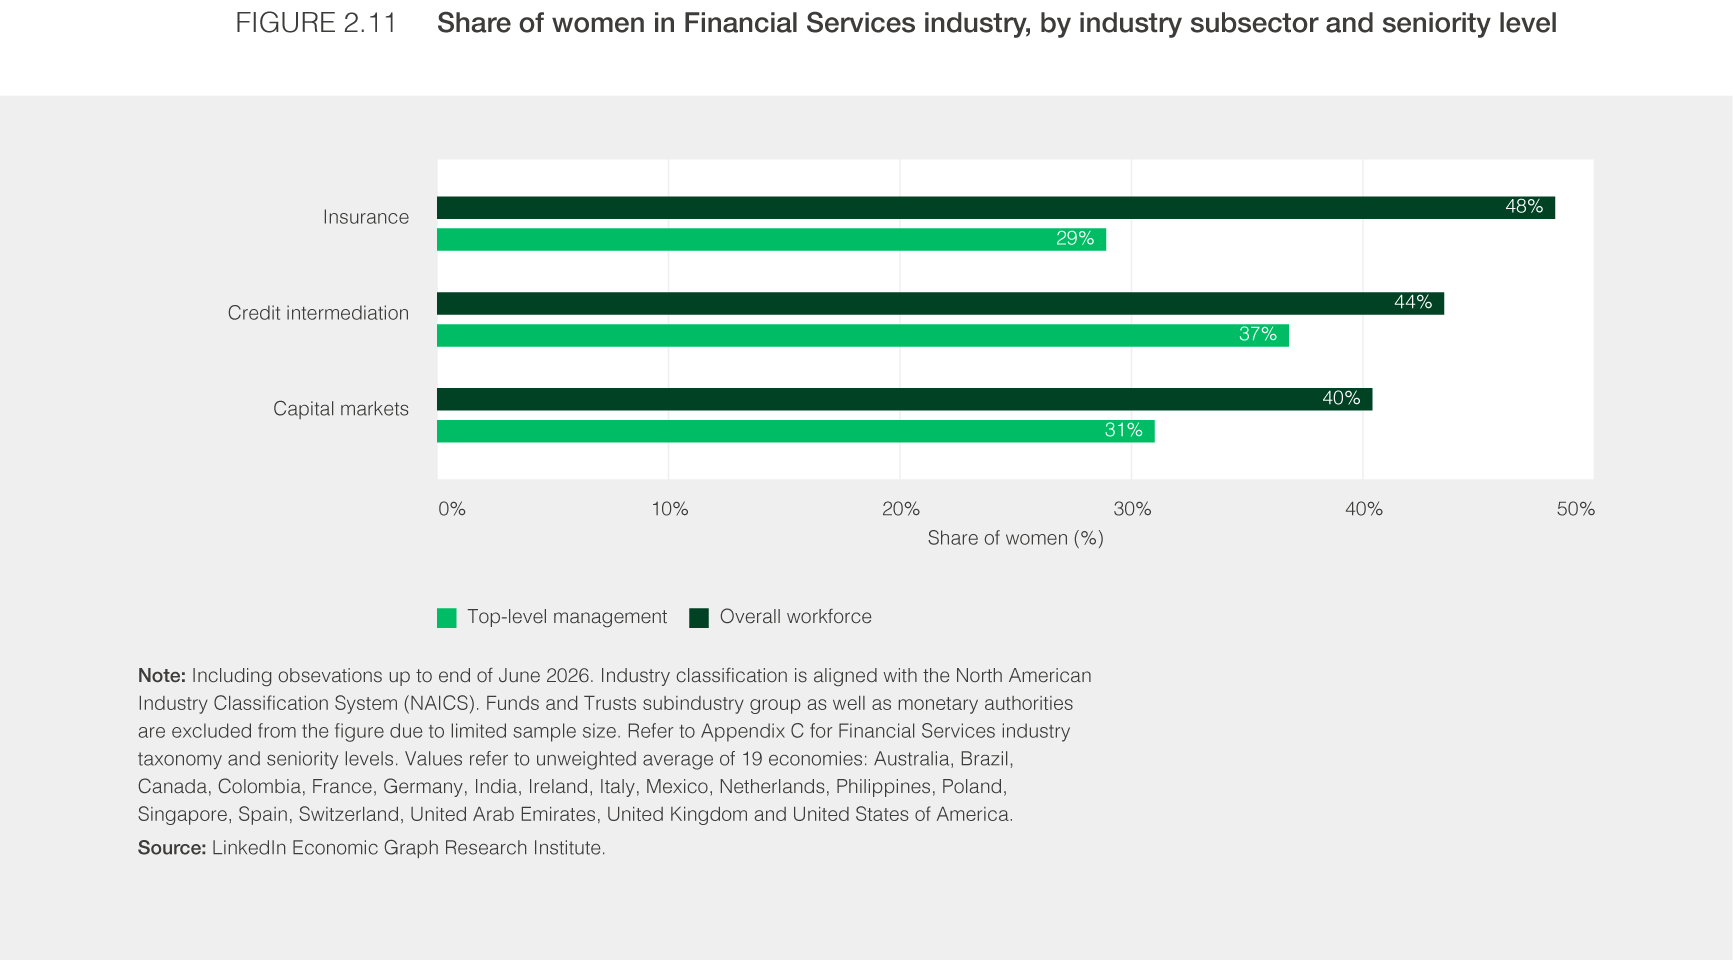

Women’s representation declines with seniority across all three segments, but most sharply in insurance, where women hold 28.9% of top management roles, around 20 percentage points below their overall workforce share. The decline is smaller in credit intermediation (36.8% vs. 43.5%) and capital-market activities (31.0% vs. 40.4%) (Figure 2.11).
Our analysis extends beyond private capital markets to public financial institutions, notably central banks. Through monetary policy, financial supervision and regulation, central banks help shape the conditions for economic growth, stability and opportunity. Their leadership composition therefore indicates the extent to which women participate in the highest levels of economic decision-making. OMFIF’s Gender Balance Index documents women’s representation across central-bank leadership and shows a rising share of women in governorships.
Considering only the economies covered by the 2026 Global Gender Gap Index, all three of the metrics tracked by OMFIF for central banks show an increase in women’s representation, although unevenly, across regions. Among governors, women hold 16.4% of positions across the cohort, rising to 19% when regional banks are included. This represents a substantive increase from around 10% five years earlier. In the same five-year period, the number of female governors increased in Central Asia, Eastern Asia and the Pacific, Europe, North America, and Southern Asia; remained unchanged in Sub-Saharan Africa and decreased in Latin America and the Caribbean. In contrast, Middle East and Northern Africa did not report any women at the highest level of central-bank leadership. At deputy governor level, the number of women increased by 39%, from 70 in 2022 to 97 in 2026, indicating growth in the overall leadership pipeline. Among senior-staff, women accounted for 29.8% of positions in 2026, up from 28.8% in 2024.
Entrepreneurship offers a further lens into how technology and capital shape access to new sources of economic value. Women's share among business founders has risen steadily over the past decade, accelerating ahead of the COVID-19 pandemic, then subsequently moderated. This growing presence among founders would suggest that access to this pathway expanded, while also raising questions about whether entrepreneurship reflects greater opportunity, changing labour-market conditions or both.
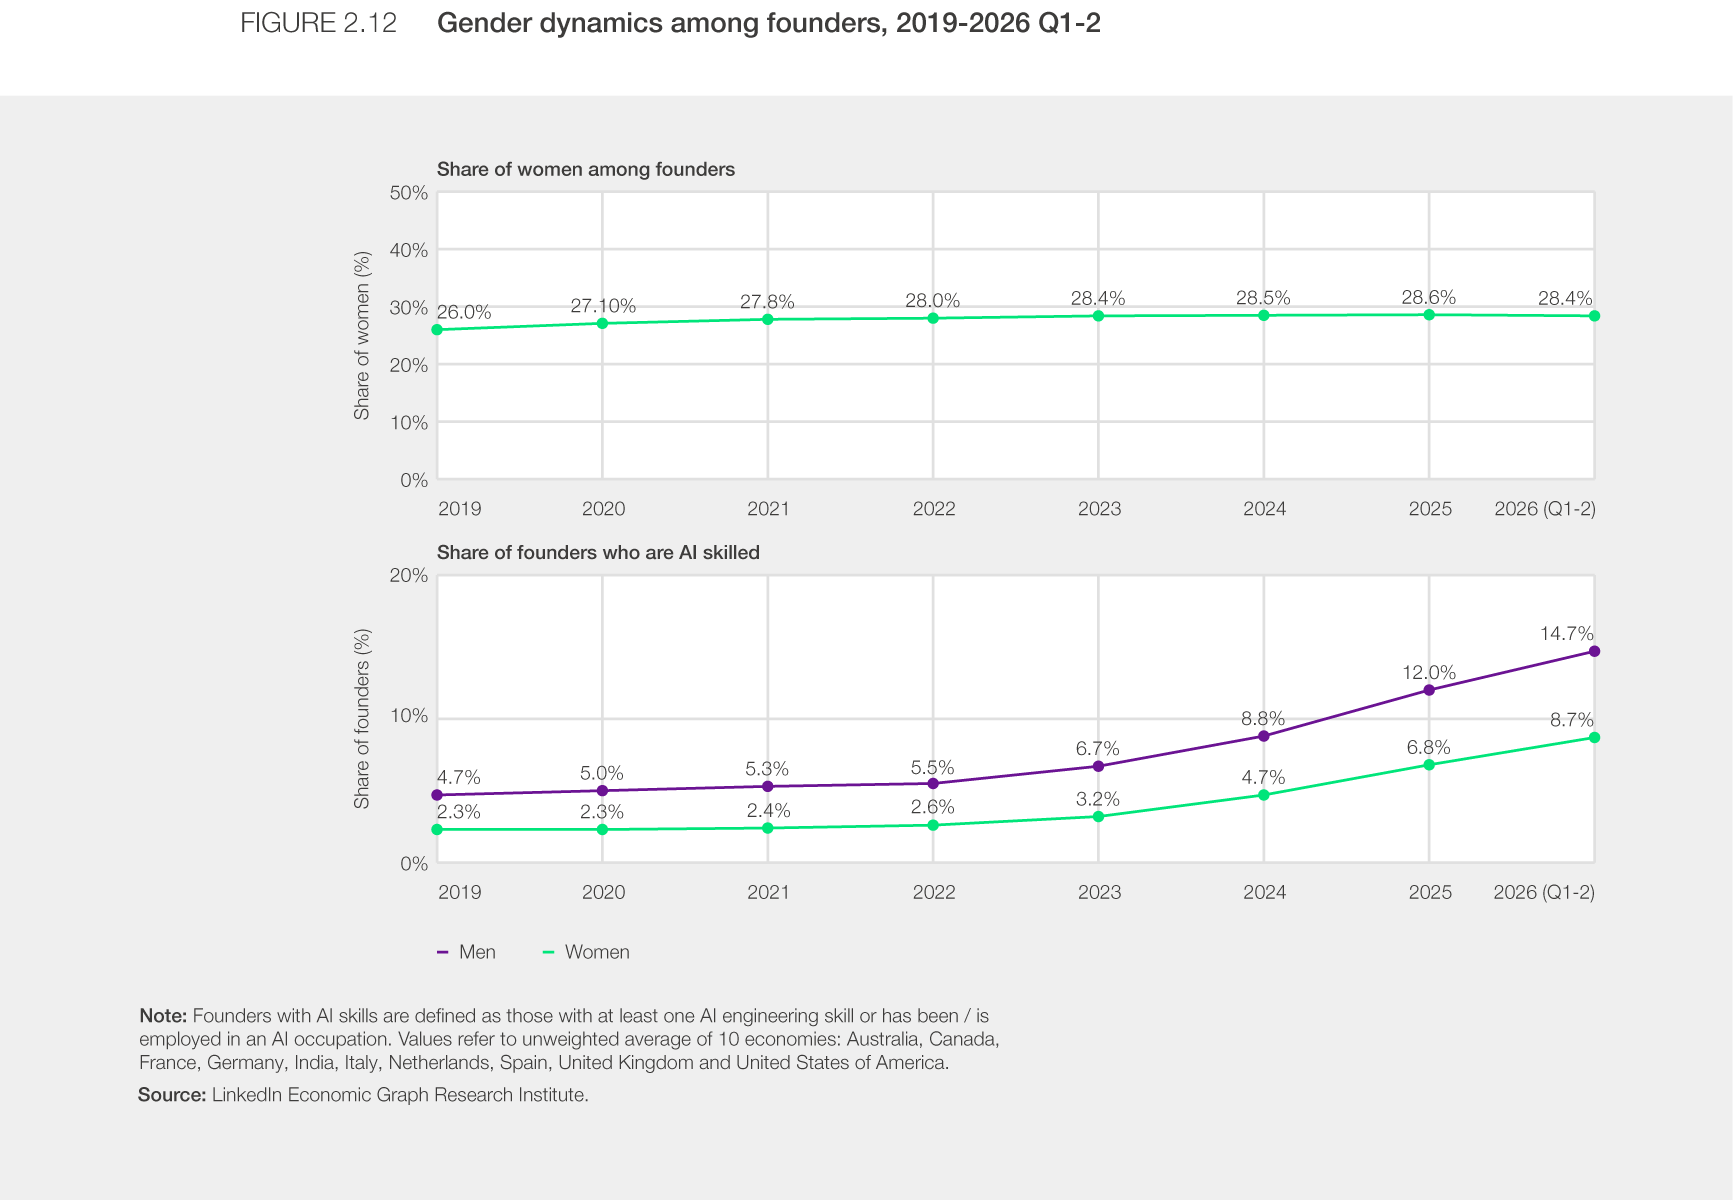
The aggregate trend is less dynamic. Women’s overall share among the number of founders has remained broadly unchanged since 2022, at around 28% (Figure 2.12). Yet the number of LinkedIn members adding “founder” to their profiles increased by 60% over 2024–2025, and more than tripled since July 2022. An additional dimension to keep in mind is that the volume of capital going to female founders is disproportionately smaller. In 2025 approximately 2% of total venture capital globally went to all-female founder teams.
At the same time, the profile of founders appears to be evolving differently by gender as AI becomes more central to entrepreneurship. The share of founders listing AI skills has risen rapidly for both women and men, but remains consistently higher among men, with the gap widening over time. In 2019, 4.7% of male founders and 2.3% of female founders were AI-skilled; by 2026, these shares had risen to 14.7% and 8.7%, respectively (Figure 2.12). However, within the broader workforce, women’s share among those listing AI engineering skills has edged up over the between 2019 and 2025, from 28.9% to 31.0%, according to the latest estimates from LinkedIn. The contrasting trends suggest that the gender gap in AI skills is evolving differently within entrepreneurship than across the broader workforce, widening among founders even as women’s representation among AI-skilled workers overall has edged up.
Taken together, the evidence from technology, finance and entrepreneurship shows that gender parity is increasingly shaped not only by access to economic participation, but also by who is positioned to create, capture and direct economic value. Differences in representation across specialized AI roles, senior financial leadership, capital-market activities and company founders point to areas where further progress could carry particularly significant economic influence. As technology and capital become more central to economic transformation, strengthening women’s participation in these areas will be increasingly critical to advancing gender parity.

Policy frameworks and political leadership
The international context in which gender parity advances is changing. In the past few decades, multilateral cooperation shaped broad policy consensus around gender parity, enabling the coordinated adoption of policy frameworks and the exercise of political leadership seeking to level the field. Today, a different and more plural landscape emerges. Understanding gender parity in this context invites benchmarking to extend its lens beyond outcomes and include in its assessment the changing nature of institutions themselves. This section maps how reforms have evolved, the type of stewardship that brought them forward, and the extent to which they are perceived to be successfully enforced. The resulting analysis shows trends in geography and substance of gender parity reform that speak to the footprint of coordinated and collaborative action on a global scale.
Evolution of gender parity reforms
From a pre-distributive perspective, institutions allocate opportunity before individuals experience it. Legal frameworks delineate the scope and manner of economic participation men and women are entitled to in their own economies, such as the right to work, to be remunerated fairly for work of equal value, to own and manage property, to take paid leave, to access credit opportunities, to access pension benefits, and more.
The World Bank’s Women, Business, and the Law project has captured a history of legal reforms spanning over five decades, with the first recorded observations dating back to the 1970s. Continuing the data collaboration established in the previous edition, this section delves into an exploration of the evolving geography of gender parity reform across the 10 issue areas captured by the project, which represent a different phase or aspect of a woman’s working life.
A string of findings emerges from the analysis of a body of nearly 2,000 legal reforms adopted across the cohort of 145 economies included in this year’s index. Figure 2.13 shows that economies have enforced an overwhelmingly positive set of reforms since the 1970s – meaning that 96% of all reform activity showed an improvement in the direction of change concerning laws and regulations for women’s economic participation.
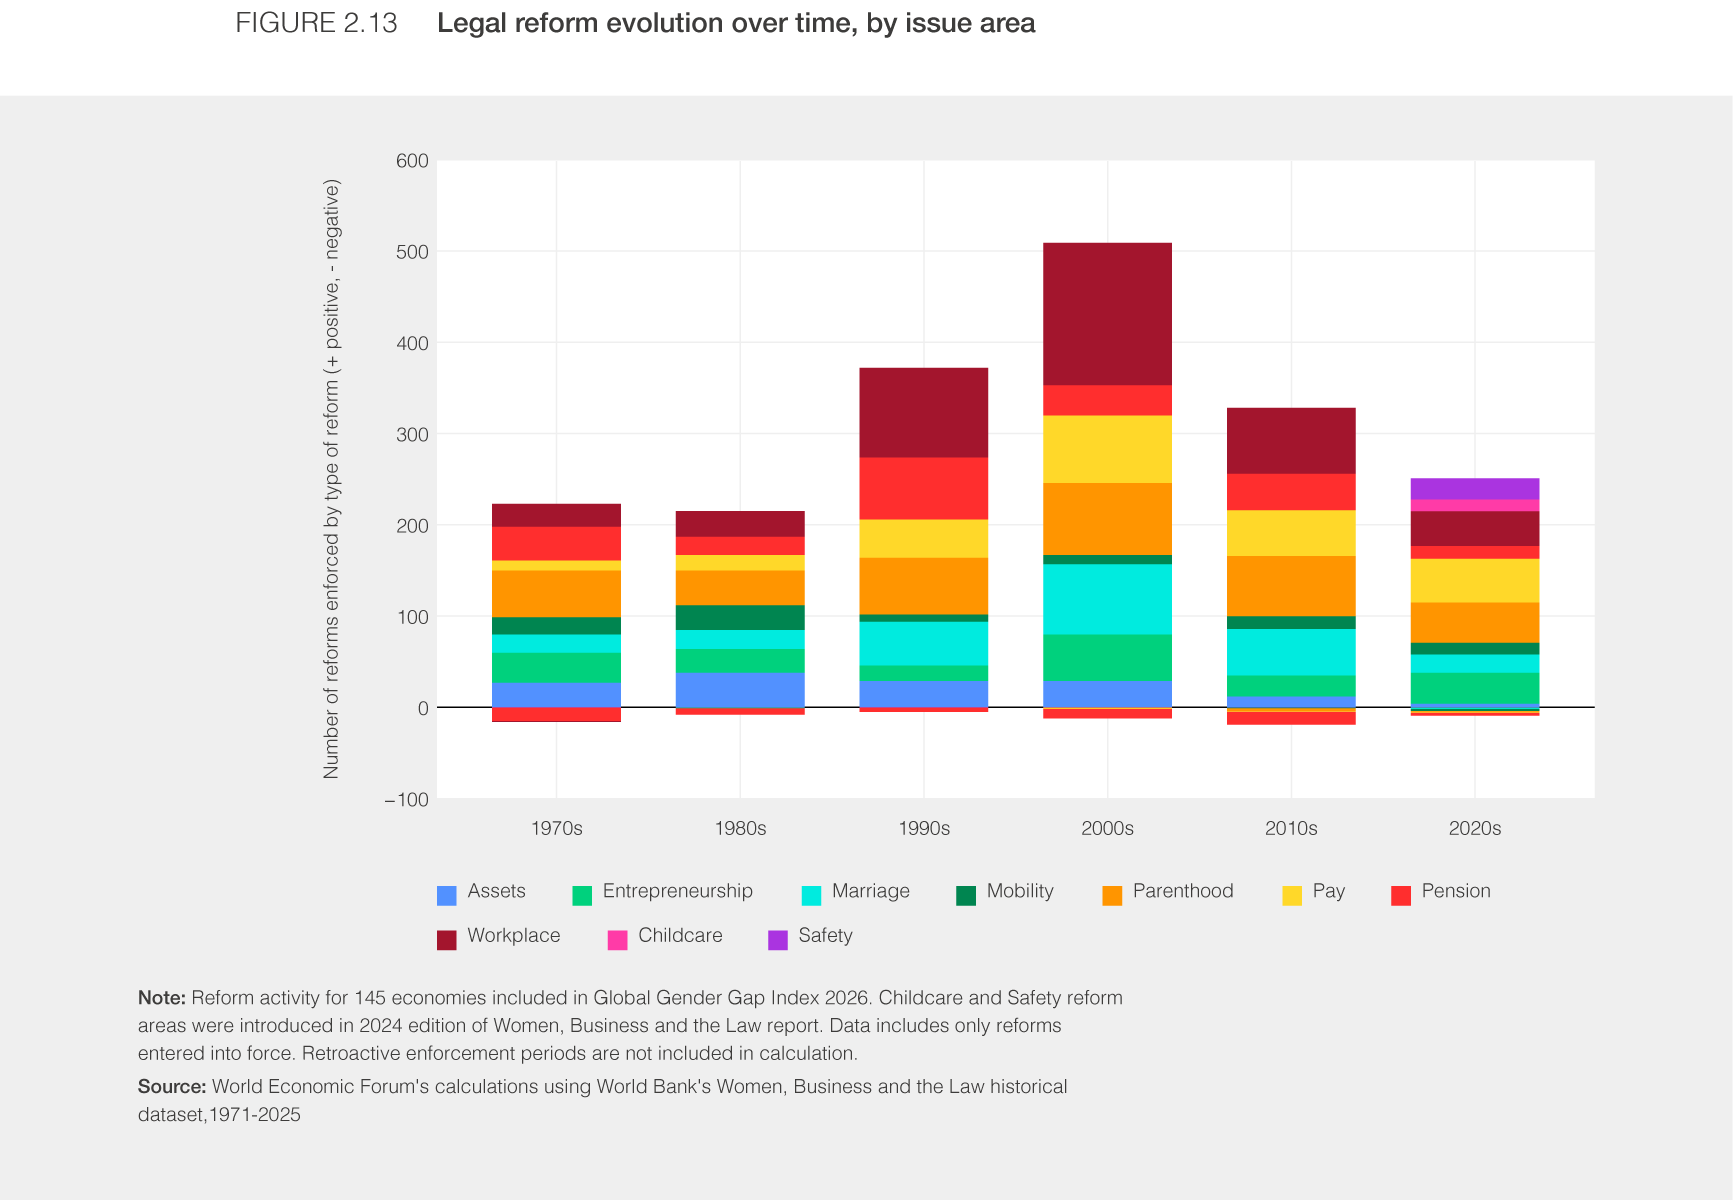

At the aggregate level, reform activity was highest during the early 2000s, with around 27% of all reforms enforced during that period. Since 1970, workplace legislation represents the largest category (21%) out of all enforced reforms, followed by parenthood (18%), and pension (14%). The latter category holds nearly three-quarters of all negative reforms enforced since 1970s, where the direction of legal change in pension regimes has reversed or reduced the scope of economic participation for women.
While reform activity has largely expanded legal rights for women worldwide, geographical regions have followed differing reform trajectories over time, as illustrated by the aggregate legal framework scores recorded by the different blocks in Figure 2.14.
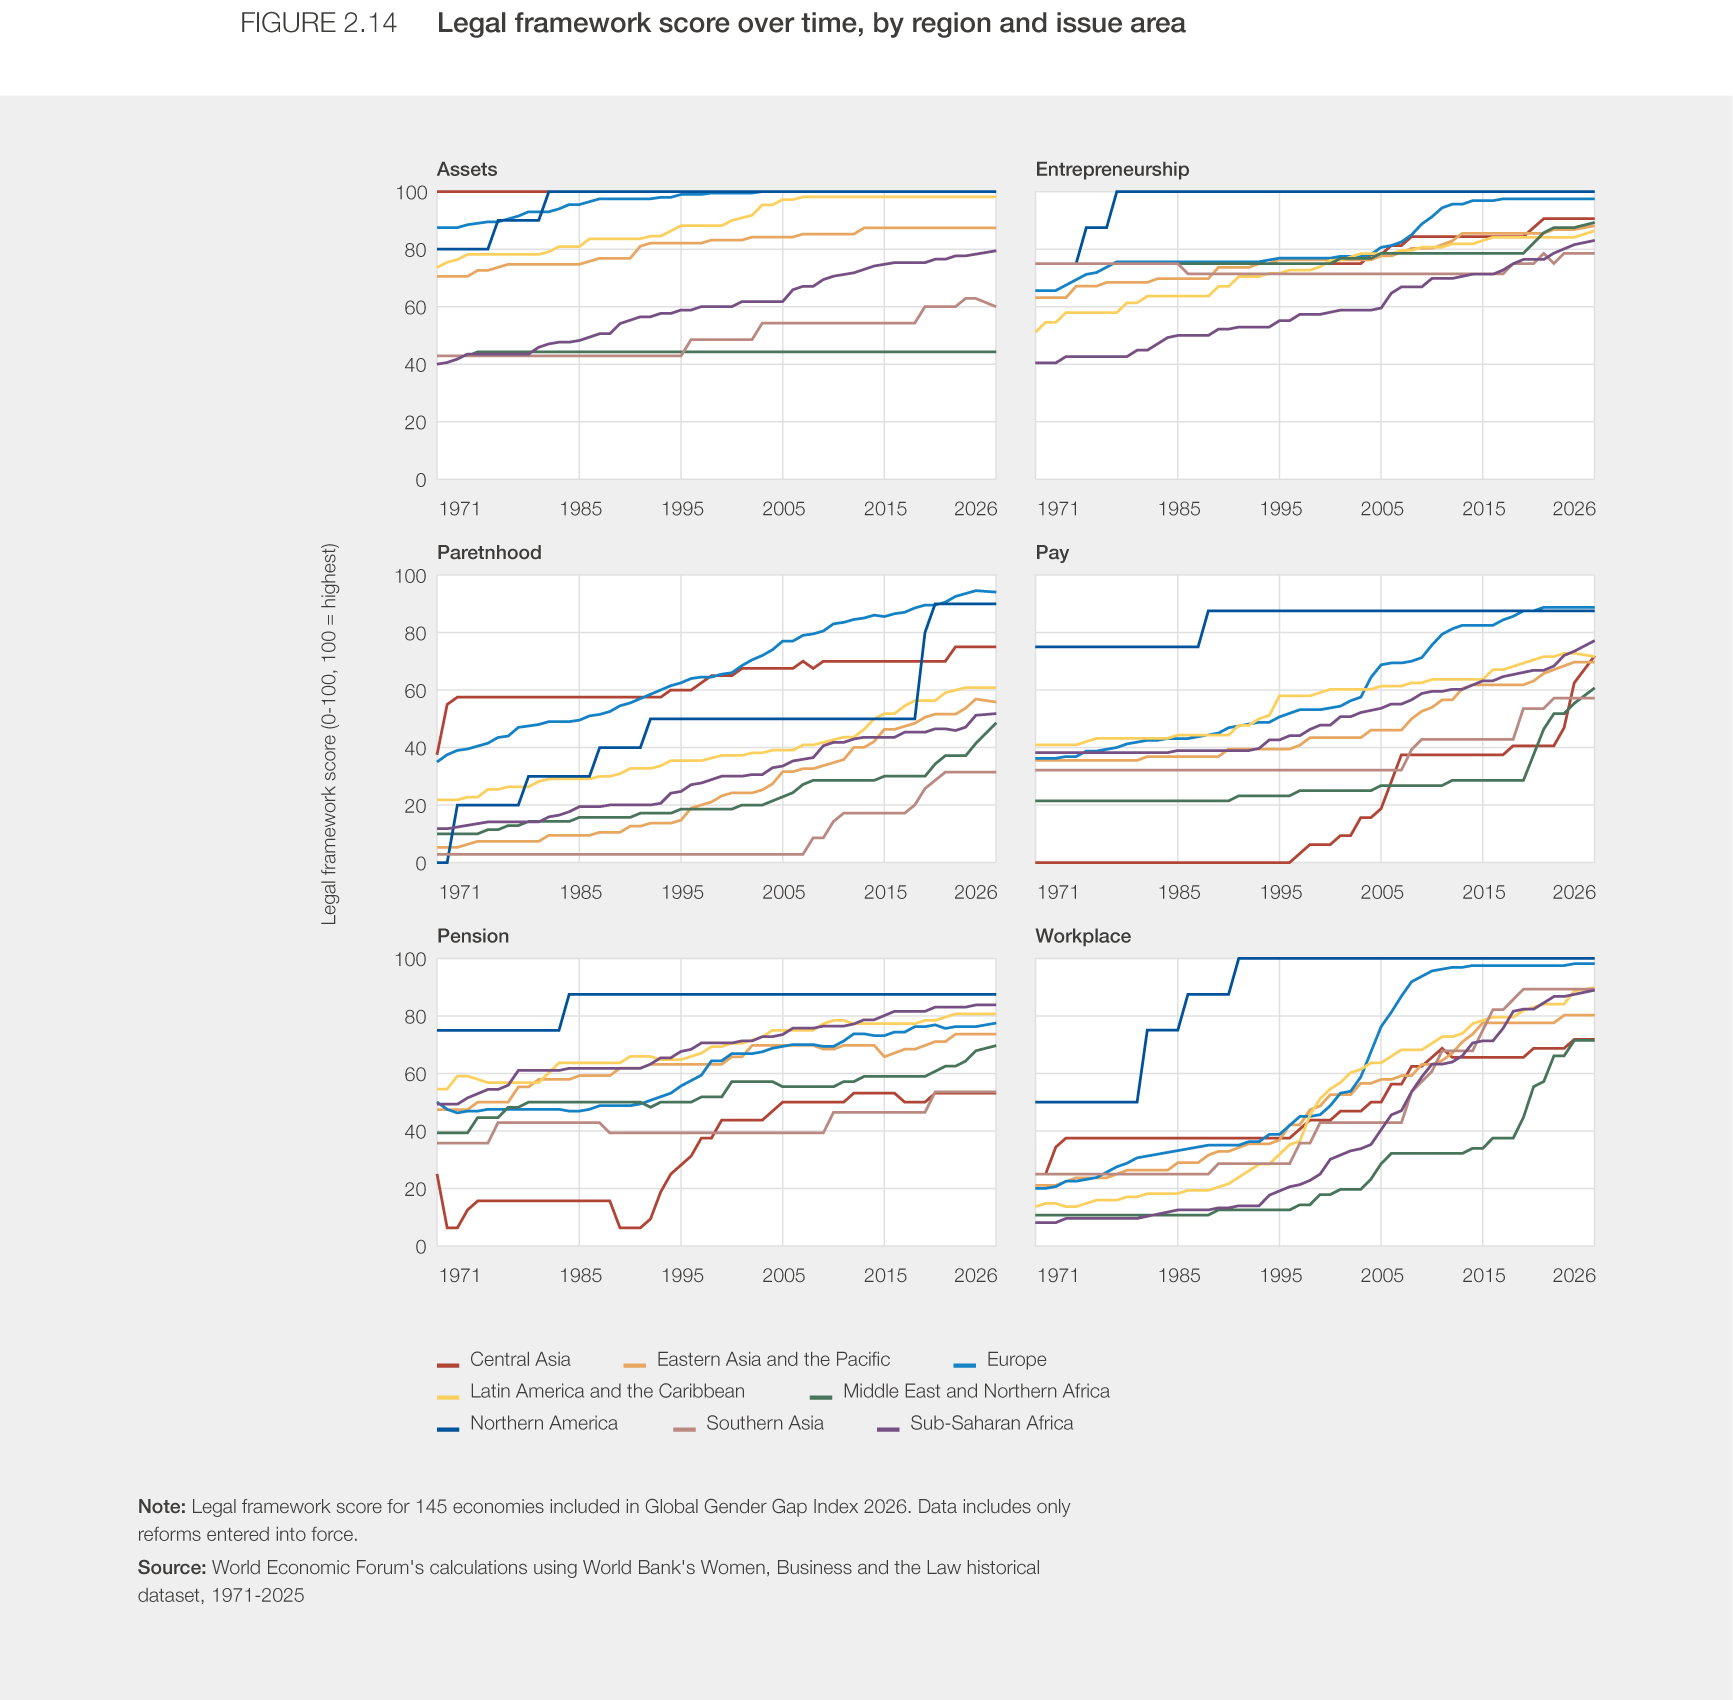

Overall, Europe, Northern America, and Latin America and the Caribbean enforced much of their reform activity during the 1990s and 2000s, while the Middle East and Northern Africa began later but has increased progressively and is the most reform-intensive region in the current decade.
While workplace reform constitutes the biggest body of reforms, regions had different starting points across reform areas. Pay and Workplace reforms emerged comparatively earlier in Northern America, although other regions caught up over the past two decades. Central Asia introduced Parenthood reforms in earlier decades. Southern Asia and Sub-Saharan Africa recorded high levels of Workplace reform from the 1990s through the 2010s; in Sub-Saharan Africa, this was followed by substantial activity in Parenthood and Assets. This latter category includes the introductoin of changes to equal rights to immovable property, inheritance rights for sons and daughters and spouses, and the valuation of non-monetary contributions in marriage dissolution. Latin America and the Caribbean focused primarily on Workplace reform, which peaked in the 1990s, followed by Marriage-related reforms. In the Middle East and Northern Africa, Parenthood, Pay, Workplace and Mobility have been active areas over the past two decades, while Pension was among the region’s earliest areas of reform. Northern America has made recent advances in Parenthood legislation.
Across the entire breadth of reform activity, Parenthood has remained a consistent feature of reform agendas, covering mechanisms such as paid leave for mothers and fathers, protections against the dismissal of pregnant workers, and whether maternity benefits are paid by the government. Pension reforms have distinctly surged across regions since the 1990s, a significant number of which are classified as negative.
As a result, rather than following a single sequence of reforms, economies have broadened the legal framework for gender parity in waves, and through diffused and contextually relevant reform agendas.
However, the legal ambition behind reform activity has not been fully met by implementation capacity. The last edition of the report found that across the entirety of economies covered by the Gender Gap Index there is a near-universal implementation gap, evidence of a lack of robust frameworks to support the translation of laws into practice. This finding is not only evidenced by the presence of supportive mechanisms, but also by the delay taken by governments to translate legal commitments into enforceable rights.
Based on the time frame that separates the enactment of a reform from its implementation, we were able to estimate an overall average implementation delay of 99 days, or three months, across the entire sample. However, when broken down by decade, we found that the time frame has ebbed and flowed over time as well. In the 1970s, the delay required to put a law into practice was on average 53 days. Between 1990 and 2010, the two decades when reforms activity peaked, translating a law from paper to practice took between 75 and 91 days. The time frame increased to 161 days between 2010 and 2019, and 96 days for the present decade.
In terms of focus areas, the data shows that for indicators with data across every decade, Childcare has the fastest enforcement window (38 days), while Pension has the slowest (218 days). This last point would suggest that differences in enforcement windows are revealing of administrative and policy complexity, as well as stakeholder coordination. Reforms typically requiring large-scale administrative readiness and multi-system coordination, such as pensions, take longer to enter into force than regulatory reforms such as equal pay.
Policy enforcement perceptions
The expansion of legal rights does not, on its own, guarantee the conversion of opportunities into outcomes. As explored in last year’s edition, the bridge in implementation is determinant to the efficacy of a legal project. To complement our analysis of reform activity and the actors who steward it, this section seeks to understand the extent to which legal projects are being experienced as intended. For this task, we analysed the enforcement perception data included for the first time in the World Bank’s Women, Business and the Law 2026 report, which draws from expert assessments of enforcement to assign a 0-4 perception score descriptive of whether reform implementation is meaningful.
Our analysis of perception scores across the economies included in the 2026 index found a range of patterns across regional blocks and indicator areas. As seen in Figure 2.15, Assets has the highest overall enforcement perception score overall (3.0). Across regions, this indicator area registers relatively high scores, suggesting a broadly formalised administrative backing for these rights, with exceptions. In the Middle East and Northern Africa and Southern Asia, the recognition of non-monetary contributions is deemed low, therefore diminishing the enforcement perception score of the indicator category.
Parenthood, Pension and Pay receive middling scores, with important differences between specific provisions. Mandatory retirement ages are among the measures perceived to be more consistently enforced, while leave entitlements and survivor benefits receive lower ratings. Paternity leave receives particularly low assessments, as do publicly supported leave provisions in Southern Asia and Sub-Saharan Africa. In Pay, equal-pay provisions are perceived as among the least effectively enforced measures, underscoring the remaining gap between formal commitments and workplace practice (Figure 2.15).
Enforcement perceptions are lowest in Entrepreneurship (1.7 overall) and Work (1.9). While the right to start a business is scored as highly enforced, especially in Northern America and the Middle East and Northern Africa, other dimensions of entrepreneurship are not – including access to credit. The enforcement of board quotas is also lowly rated across several regions, whereas public-procurement provisions receive somewhat stronger recognition. In terms of employment, the right to work is deemed to be better enforced than protections against discrimination in recruitment or access to flexible working arrangements (Figure 2.15).
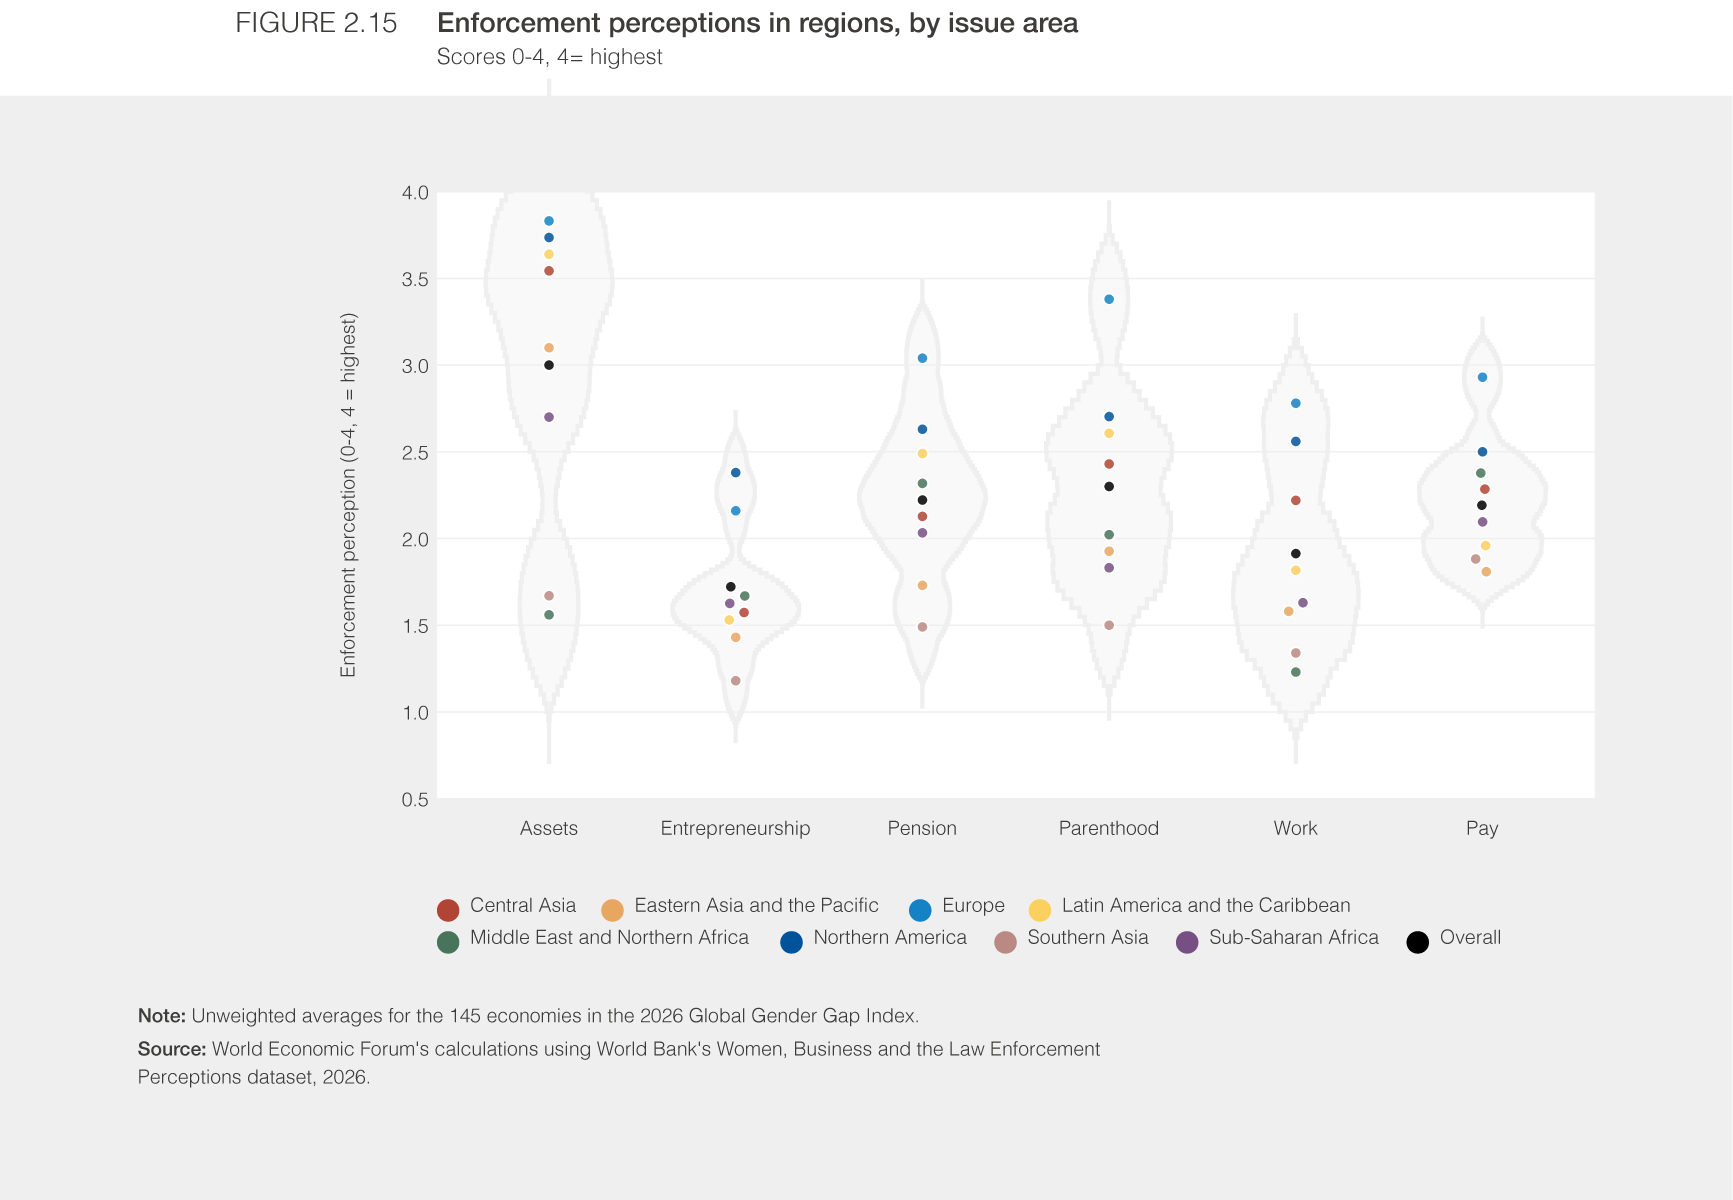

These patterns reflect how strong coordination of stakeholders and systems is needed to fully and effectively implement reforms. Rights relating to asset-holding are backed by formal legal codes and administrative services, while entrepreneurship and workplace equality require the additional coordinated adherence of employers, financial institutions, and workforce regulators. These findings would suggest that reform implementation is challenged when administrative, legal, industrial and social systems fail to coherently coordinate to translate legal rights into lived economic opportunity.
Representation trends in parliaments
Those who exercise political leadership in legislative spaces steward the expansion of economic entitlements over time. Women’s equal representation in parliament can be appreciated as both an outcome of political and economic empowerment as well as a vehicle to expand it. Understanding how this category has evolved over time, particularly with regards to gender parity, offers insights into one of the most resilient dimensions of the index.
Over time, the Global Gender Gap report has tracked the share of women in parliament within its Political Empowerment subindex. The metric has proved to be not only stable, but one of enduring gains: since 2006, gender parity in parliament has increased +13.6 percentage points without registering overturning reversals, reflecting a continued and absolute aggregate increase in the share of women holding legislative seats globally (Figure 2.16).
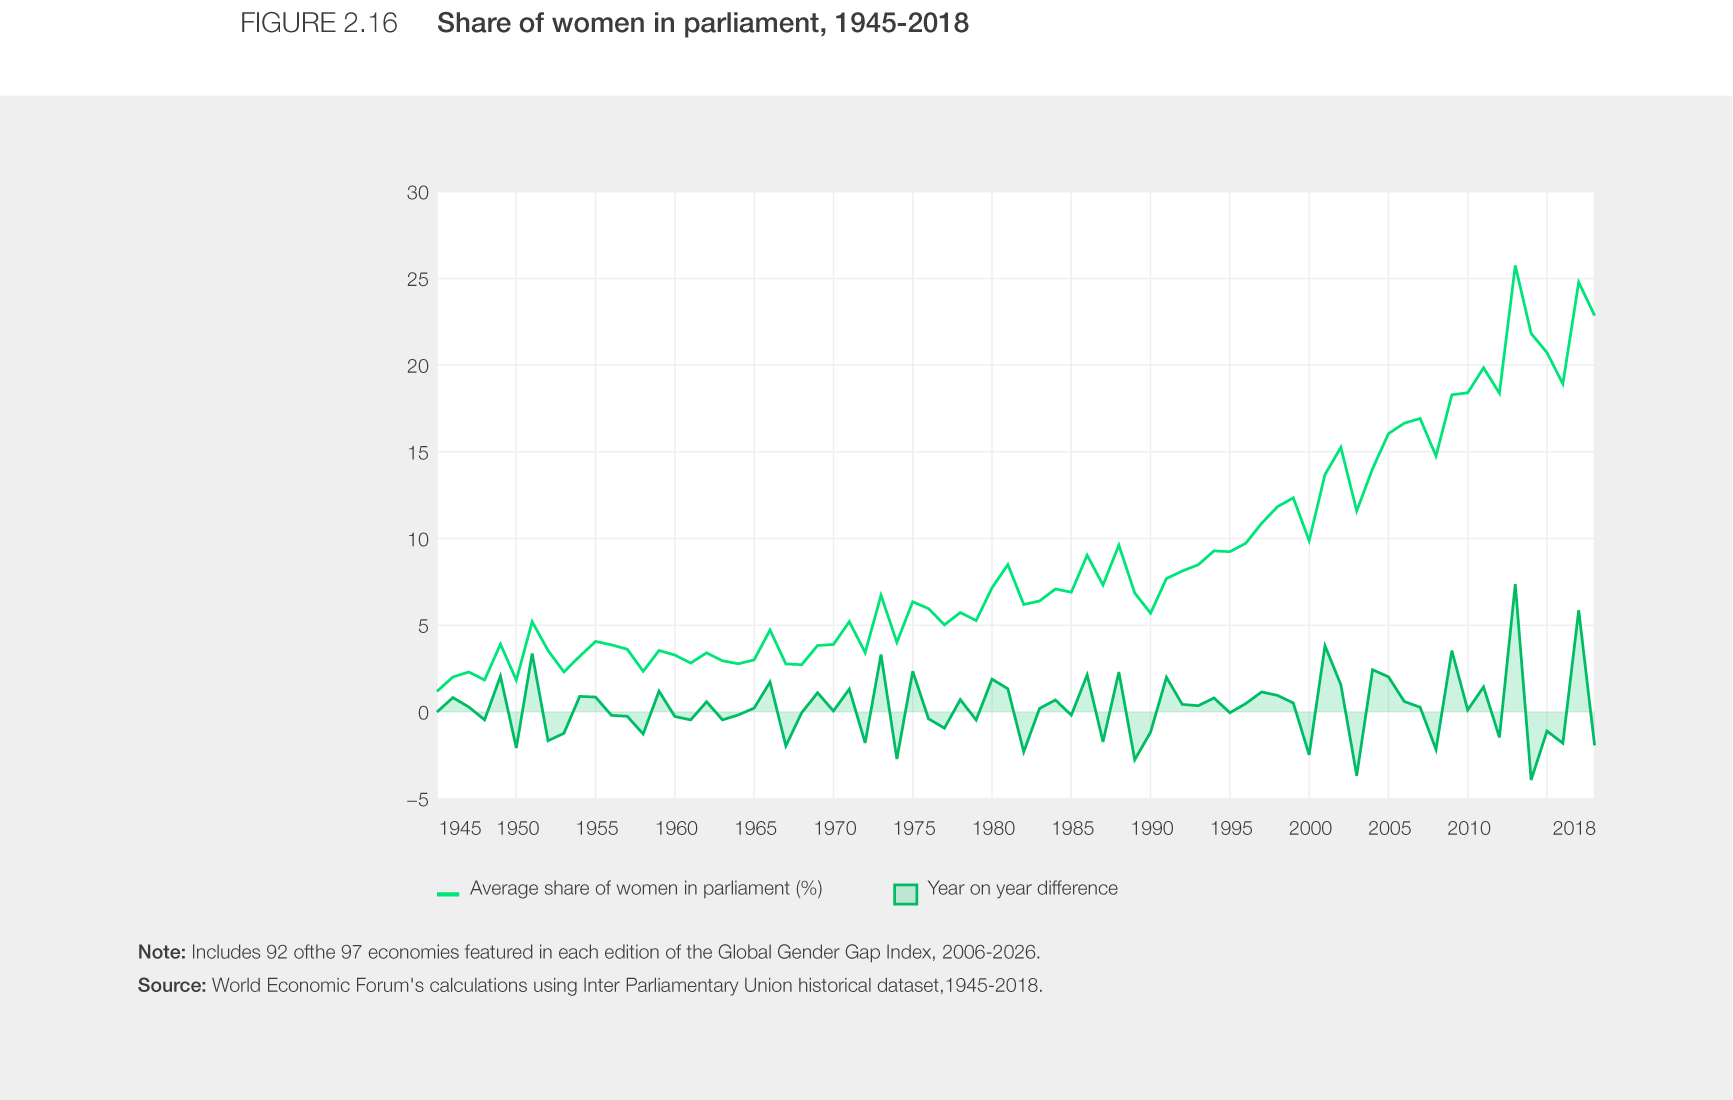

Across the index sample, nearly all economies show progressively rising numbers for women’s participation in parliamentary chambers, showing the incremental and persisting nature of parity gains in this domain. Between 1945 and the early 1970s, women occupied on average less than 5% of parliamentary seats. The line progressed upward over the next two decades, finally crossing the 10% threshold in 1997. This period was marked by the United Nation’s Decade for Women (1976–1985), and by the adoption of the Beijing Declaration and Platform for Action in 1985, which introduced a global roadmap for gender equality. In the last 30 years, the rate of change further accelerated. Since then, legislated gender quotas have been introduced and adopted across 82 of the 97 of the economies tracked.
Historical data from the Inter Parliamentary Union further illuminates some of the underlying components of that change, particularly with regards to the timing of advances in lower chambers. An analysis of election intervals between 1945 to 2018 across the constant set of 97 economies tracked by the index revealed that women’s representation in parliament has increased on a mostly consecutive basis. Over half of election intervals rendered positive changes in parliamentary seats held by women, with average consecutive increase of +1.3 percentage points. Moreover, changes were increasingly significant in the decade following 1995, with annual increases averaging +0.7 percentage points until 2005 and +0.5 percentage points in the decade after, between 2005–2015. Jumps in female representation became also more frequent in these decades.
Representation trends in ministerial positions
The Global Gender Gap Index has also tracked the state of gender parity at ministerial level for the past twenty years. This indicator, listing the share of women in ministerial positions, has accounted for the level of political representation women have had within a critical layer of governance systems where national priorities are set, resources allocated, and industry activity is promoted.
The 2025 edition of the report offered a complementary assessment of that indicator that looked at the category of portfolios led by women ministers. This year, our analysis extends throughout time and across the nature of the portfolios themselves, to assert not only presence in the political plane, but power exerted in the form of ministerial influence over key policy domains.
The data analysed was drawn from UN Women and Inter Parliamentary Union's annual Women in Politics maps, specifically data points on portfolios held by women ministers, in consecutive editions from 2008 to 2026.
Overarching findings show an overall 26% increase in the number of portfolios headed by women ministers since 2008, suggesting an expansion of their representation in policy areas over time. However, the data also mirrors the index’s reversal in ministerial parity between 2016 and 2026, as the count of portfolios headed by women declines slightly from and since posting its highest value in 2020 as illustrated in Figure 2.17.
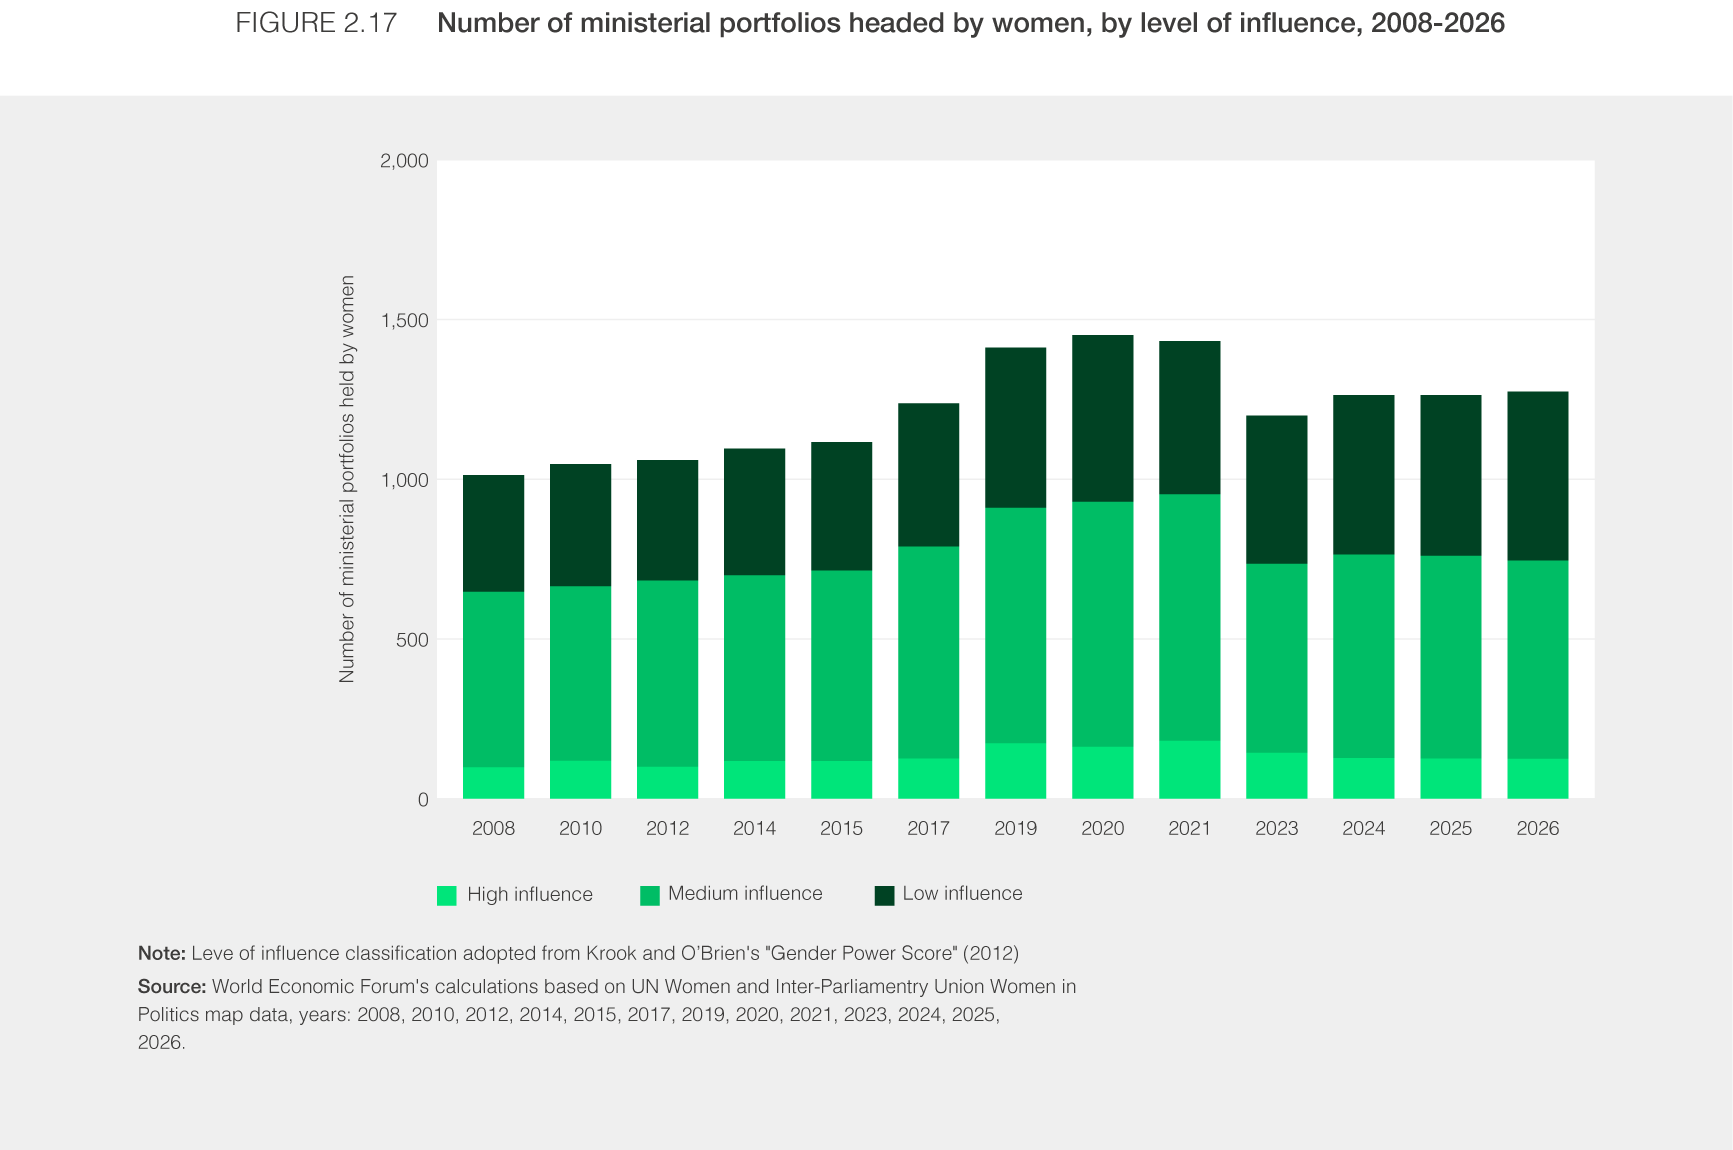

Overall long-term gains are also muted when considering the type of portfolios women are leading. Classified in accordance with their visibility, budget share, staffing and resourcing, as well as its proximity to executive power, almost half of the portfolios that women ministers spearheaded in 2008 were of medium influence, and only one in 10 portfolios held by women was high influence. Nearly 20 years later, the distribution remains virtually unchanged despite the absolute increase in portfolios led by women (Figure 2.17). In 2026, the share of medium influence portfolios held by male ministers in 2026 is similar to that held by women, at 63.2%, yet there are nearly twice as many high prestige portfolios led by male ministers in comparison (17.5%).
While the taxonomy used includes over twice as many portfolios in the low-influence category than in the high-influence once, the average portfolio increase in the low-influence category was nearly triple that of the high-influence one, and more than four times that of middle-influence. Across the years, the women-led portfolios that increased most in number are Social Affairs, followed by Energy and Mining and Tourism. In contrast, the women-led portfolios that shrunk in number are Trade, Local Governance, and Justice. This suggests that cabinets are expanding representation in less-influential areas of government, similar to patterns of top-level female leadership in the corporate sector, as shown in Figure 2.3.
The dynamics observed in ministerial leadership mirror to a degree those seen in senior corporate leadership in both time frame and nature: both occurred in the years leading to the COVID-19 pandemic, and throughout its first phase, and both trends saw women’s leadership grow in public and private spheres. Across both public and private sectors, women have secured more roles, but not necessarily higher influence, suggesting the barrier to parity lies in allocation, and not in talent or leadership availability.
Representation trends at head of state level
As the global economic and governance system is undergoing profound changes, the final section attempts to give an indication of how well women are placed in the highest levels of government to shape what comes next.
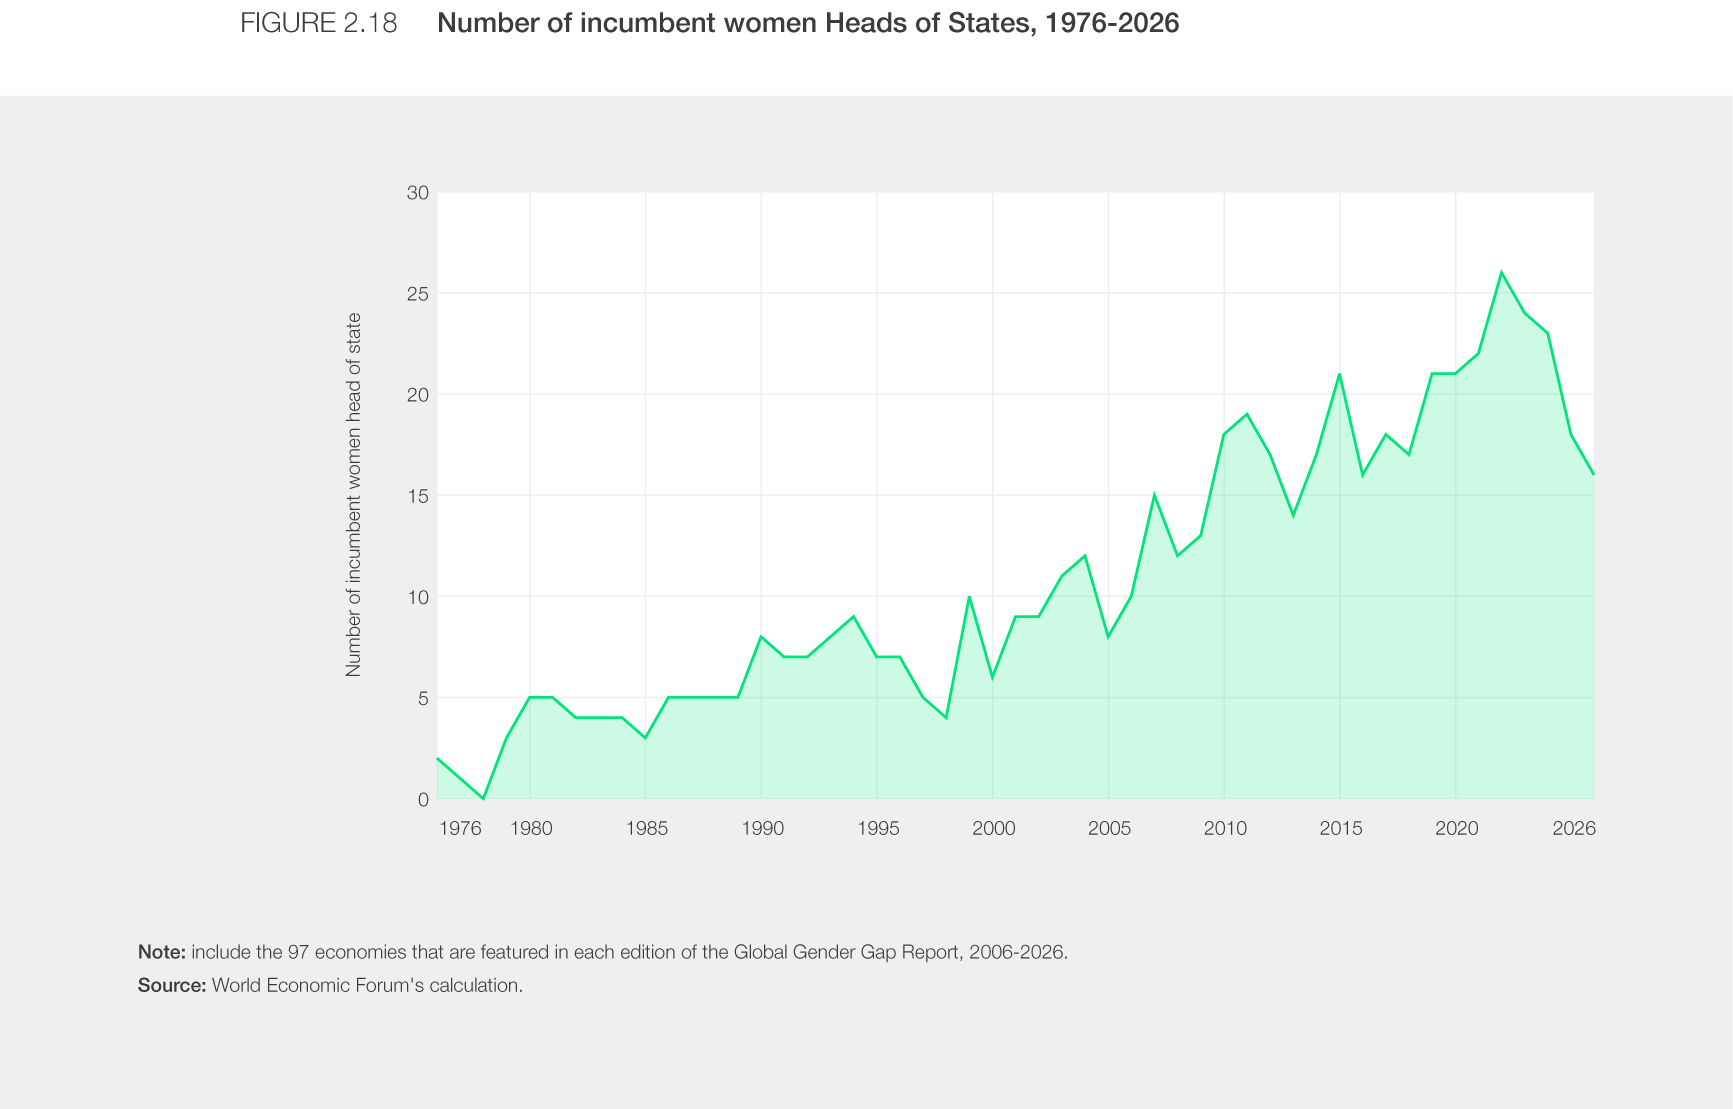
In the past 50 years, both the number and share of women leading economies have followed positive curves, increasing the representation of women at the highest level of political office. However, the overall trend hides an important degree of movement over the years. This is particularly relevant when considering that over the same 50-year period, the highest level of political representation achieved for head-of-state roles held by women was 27% in 2022, or less than one in three world leaders across the economies in the constant sample tracked by the index over time. Between 2016 and 2022, the number of women incumbents in head-of-state roles climbed to said peak, only to decline steeply in the years to follow to the same levels reported in 2016 – a full reversal within the space of a decade (Figure 2.18).
This trend chimes with findings presented in earlier sections on the reversal of hiring trends for women into top corporate leadership. Both are trends that will need to be closely watched.