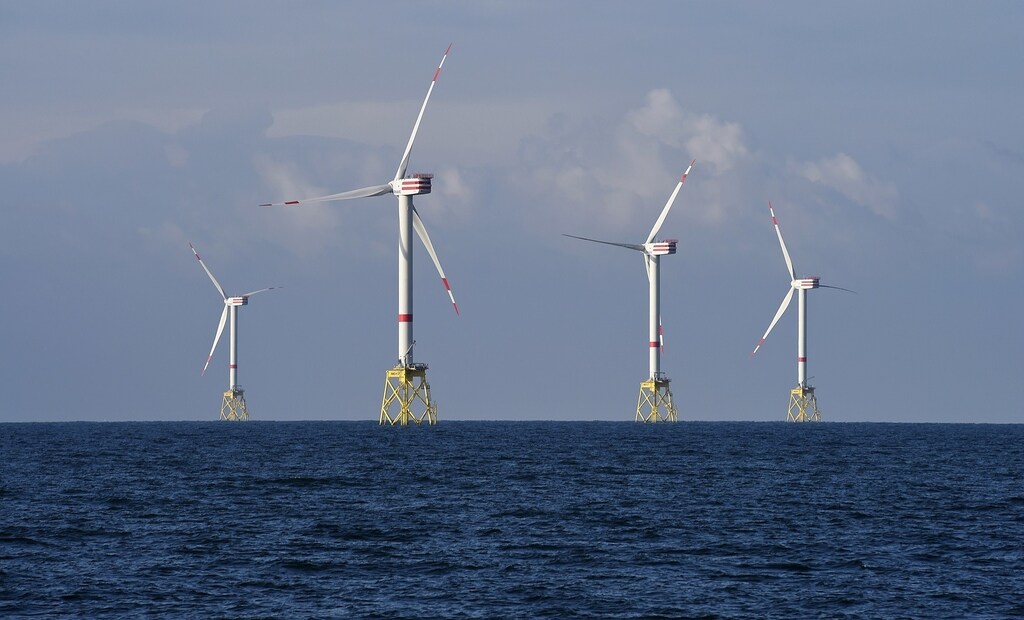
The Paris Climate Agreement calls for a global reduction in emissions in order to keep global warming within 2 degrees Celsius above pre-industrial levels. A key part of achieving this goal will be a shift away from fossil fuels, towards renewable energy sources.
Last year saw record levels of investment in green energy. “Renewables are becoming ever more central to our low-carbon lifestyles, and the record-setting investments in 2015 are further proof of this trend,” explained UN Environment Programme Executive Director Achim Steiner.
These four charts will help you visualize the growth of global renewable energy.
A year of milestones
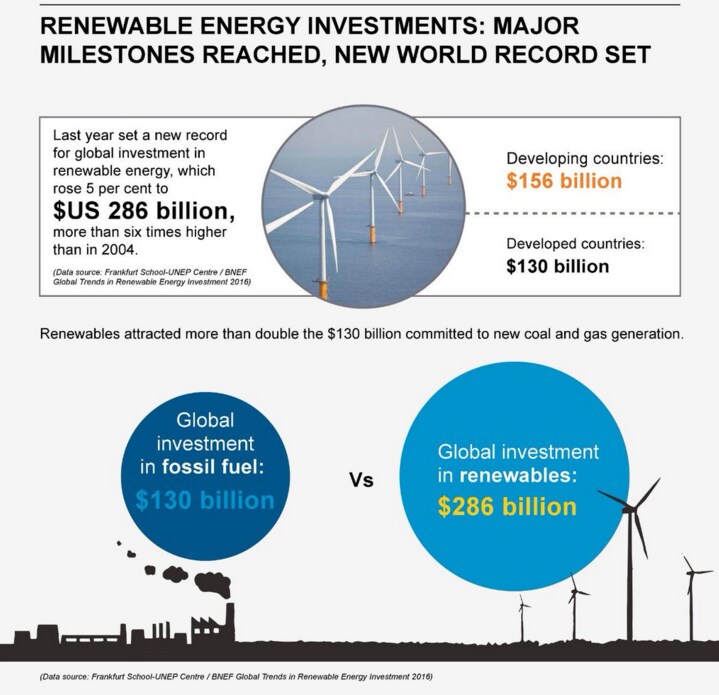
2015 was a significant year for renewable energy. This graphic from the UN highlights some of the major milestones achieved last year. Overall spending hit record levels, at US$286bn – over double the investment in fossil fuels. Additionally, for the first time, developing countries invested more than the developed world.
China leads the way
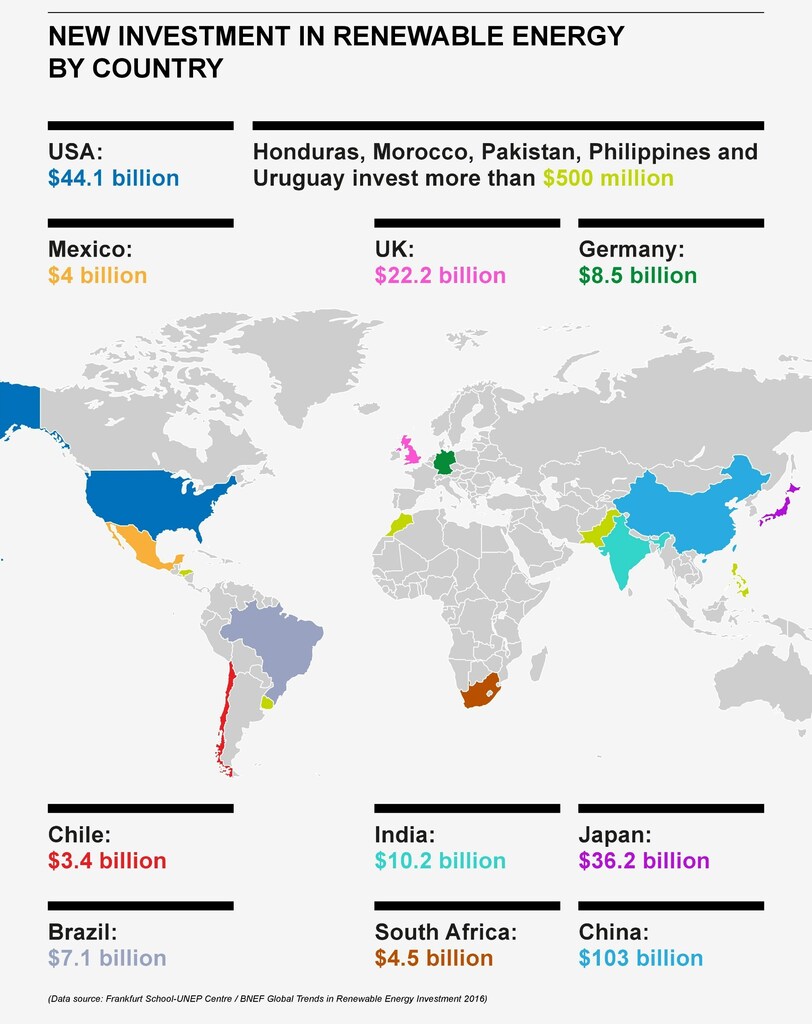
In terms of investment, China is leading the charge towards a renewable future. Their total spend topped $100bn, which accounted for over a third of the total global investment. Other countries also saw significant increases in their green investment from 2014 to 2015. Chile, South Africa and Mexico all saw spending rise by over 100% on the previous year’s total.
Falling costs shine a light on potential of solar
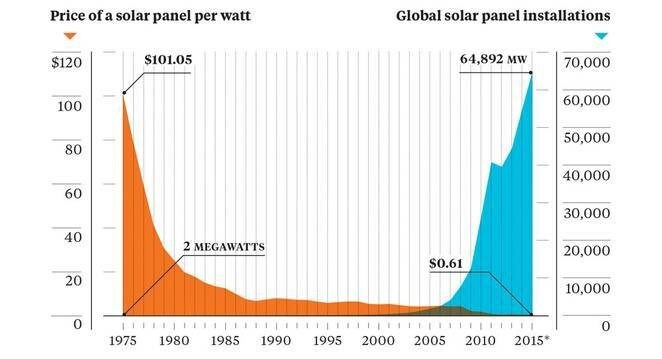
This chart from Bloomberg shows the impact of falling costs on the installation of solar panels. It emphasises the increase in electricity generation as the cost of panels has declined. Equally, it highlights the importance of constant innovation, and indeed investment.
Winds of change
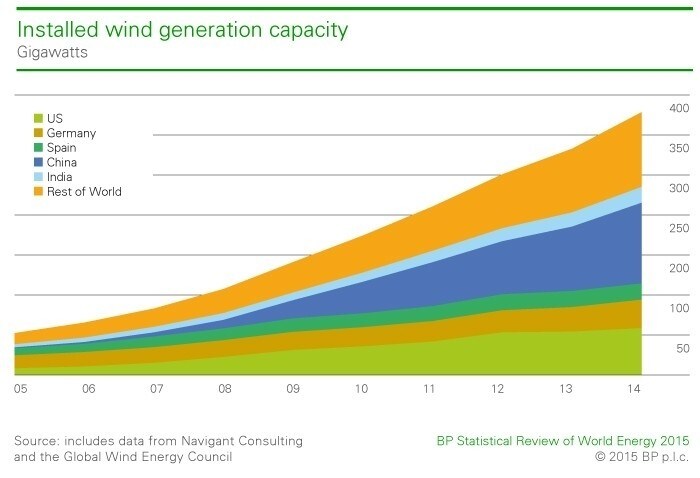
It’s not just solar capacity that’s on the rise. As this BP chart shows, even in the last decade, wind power has seen a rapid increase in capacity. Just five countries dominate global capacity, but the contribution of the rest of the world is still significant. With European investment in offshore wind projects hitting record levels last year, wind power generation is set to rise further.
Have you read?
How can we fast-track climate action?
6 countries leading the charge towards renewable energy